Abstract
In this chapter, a number of quick methods for generating digital Fresnel holograms are introduced. For an object comprising a small number of depth planes, the layer-based method implemented in the Fourier space is preferred for fast hologram generation. The point-based method is more suitable for generating objects with a large number of object points that are scattered over a wide range of distances from the hologram plane. To enhance the speed of hologram generation with the point-based method, different variants and sizes of the look-up-table (LUT) algorithms to trade-off computation time are described. A number of methods based on the concept of a wavefront recording plane (WPR) are presented. Being different from the LUT approach, the WRP methods speed up the hologram-generation process. Instead of generating the full hologram for each object point, only a small area of fringe patterns is computed on a WRP that is at close proximity to the object space. The computation time is substantially reduced. Further enhancement of the computation speed is attained with the warped wavefront recording plane (WWRP) method. A 3-D object image is decomposed into a 2-D intensity image and a depth map. The intensity image is used to generate an interim hologram on a WRP. Different regions of the hologram fringes on the WRP are resized according to their distances (obtained from the depth map) from the hologram plane to generate a hologram from the WRP.
2.1 Introduction
In Chapter 1, computer-generated holography (CGH) was briefly reviewed. Basically, CGH is a simulation of optical holography whereby the interference pattern of light waves diffracted from the surface of a 3-D object is recorded on a light-sensitive medium known as a hologram. The process can be numerically computed by applying the Fresnel diffraction equation on a computer graphic model of the 3-D object. Although CGH is not a complicated process in itself, the amount of computation involved in generating a hologram is overwhelming, especially if the size of the hologram and the object space is large.
To estimate the number of arithmetic operations that are required to generate a hologram with the point-based method, the expression in Eq. (1.14) is rewritten:
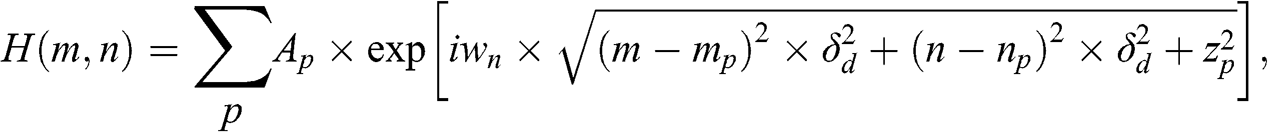 (2.1)
(2.1) where wn=2πλ . Suppose a hologram is discretized into N rows and M columns, the total number of hologram pixels is M× N. Assuming the constant δd2
 is known in advance, the total number of operations to compute a hologram is in the order of (M×N×P)
 , where P is the number of object points. Each operation is used to calculate the magnitude and phase of the optical wave of an object point that impinges on a hologram pixel. The arithmetic calculations involved in each operation are listed in Table 2.1.
Table 2.1 List of steps and the associated functions for computing the value of a hologram pixel of a single object point
| Arithmetic functions | Quantity | |
|---|---|---|
| Addition | + | 2 |
| Subtraction | − | 2 |
| Multiplication | × | 4 |
| Square | a2 | 4 |
| Square root |  | 1 |
| Exponential function | exp() | 1 |
As the pixel size of a hologram is in the order of wavelength of light, the number of pixels in a hologram is generally extremely large. For example, if the pixel size δd is 5 μm, a small hologram of 10 × 10 mm already contains two megapixels (2 × 10⁶), which is equivalent to the number of pixels in a domestic television. If the number of object points is the same as the number of hologram pixels (i.e., P= M× N), the number of operations is (2 × 10¹²). Even with modern computers, generating a hologram at a video rate of 25–30 frames per second is still an extremely challenging task.
Eq. (2.1) shows that the computation of each hologram pixel is independent of the others. A straightforward way of speeding up the hologram-generation process, therefore, is to employ a set of processors to work in parallel. Each processor will be dedicated to the computation of a unique hologram pixel. This kind of parallel operation can be realized with graphical processing units (GPUs). However, the speed enhancement is rather limited, and fast processors also lead to other problems such as size, power consumption, and heat dissipation. Numerous research attempts have been made since the early 1990s to speed up the hologram-generation process with fast algorithms that can be realized with parallel processors.
In this chapter, a number of fast hologram-generation methods that have been developed in the past decades will be reviewed. Some of these algorithms reduce the steps (or arithmetic operations) involved in the numerical realization of the CGH equations, while others are based on simplifying the hologram-generation process. This chapter describes a number of fast algorithms for generating a hologram from a set of object points.
2.2 Realization of CGH with Fourier Transform
As mentioned in Chapter 1, if a 3-D object space is composed of a large number of object points and few layers, the layer-based method is more computationally efficient than the point-based method. In the layer-based method, the object space is decomposed into a sequence of uniformly spaced image planes that are parallel to the hologram plane. Each image plane is located at an axial distance zj from the hologram, and the object points on it are represented with the intensity distribution Ij(m,n)
 . The distance zj
 is commonly referred to as the depth, and the image planes as the depth planes. Within the jth depth plane, all the object points have identical depth zj
 from the hologram, and the hologram Hj(m,n)
 can be generated as
 (2.2)
(2.2) where fzp() is the Fresnel zone plate. Equation (2.2) can be rewritten as a convolution operation:

Equation (2.3), in turn, can be realized in the frequency space. Suppose Ij˜(ωm,ωn)  and fzp~(ωm,ωn;zj)
 represent the Fourier transform of Ij(m,n)
 and fzp(m,n;zj)
 , respectively, the hologram can be computed as
 (2.4)
(2.4) where ℑ[] is the forward Fourier transform, and ℑ−1[]
 is the inverse Fourier transform. The hologram of the entire object space is equal to the sum of the holographic signals from all the image planes.
From the software implementation point of view, Eq. (2.4) can be conducted more swiftly than the convolution operation in Eq. (2.3), as it only involves a multiplication operation for each point in the frequency space. Both the forward and the inverse Fourier transform can be realized with fast Fourier transform (FFT), which is more computationally efficient than the convolution operation.
By the same principle, the numerical reconstruction process in each focused plane can also be speeded up with FFT. The reconstructed image IR;j(m,n) at the jth focused plane can be obtained from the hologram as follows:
 (2.5)
(2.5) which can be rewritten as
 (2.6)
(2.6) From the software implementation point of view, realizing Eq. (2.6) with FFT is considerable faster than convolution. However, Eq. (2.4) also shows that the computation can be overwhelming with a large number of depth planes. In the rest of this chapter, some of the contemporary methods for fast generation of digital holograms will be explained.
2.3 Direct Look-Up Table Method
A common practice to decrease the computation time in software programming is to store in the computer memory precomputed results of some tedious functions that have a high chance of being repeatedly used in the future. Such an approach is known as the look-up-table (LUT). The use of LUTs for speeding up the CGH process can be traced back to the works of Lucente in the early 1990s [1]. From Eq. (2.1) and Table 2.1, it can be seen that lots of arithmetic calculations are involved in deriving the expression Ap×fzp(m−mp,n−np;zp) . These calculations can be waived if the values corresponding to all the combinations of the six variables {Ap,m,n,mp,np,zp}
 have been computed in advance and stored in the computer as a LUT. A hologram pixel at location (m,n)
 can then be obtained with the flowchart shown in Figure 2.1.

Figure 2.1 Flowchart for generating a hologram pixel with the LUT.
Assuming that the time taken to fetch the data and variables from the computer memory is negligible (which is generally valid for modern computers), generating a hologram pixel only requires one additional calculation (i.e., the shaded box in Figure 2.1) for each object point, which is significantly less than the computation listed in Table 2.1. For a hologram of size M×N , and an object space with P object points, the number of arithmetic operations is reduced to (M×N×P)
 additions. On the downside, a huge LUT is required to store the precomputed values. An estimation of the size of the LUT is given as follows. Suppose the object space is evenly partitioned into D
 image planes along the axial direction, and the intensity AP
 is quantized into L
 levels. All the image planes are assumed to have identical horizontal and vertical extents as the hologram (i.e., size = M×N
 ). The total combinations from the six variables {Ap,m,n,mp,np,zj}
 are L×M2×N2×D
 . If each entry of the LUT is represented by B bits, the size of the LUT will be (L×M2×N2×D×B)
 bits. As an example, a small square hologram (i.e., M=N
 ) of size 1024×1024
 representing an object scene of similar dimension, with eight depth planes, L=256
 , and B=16
 (eight bits for each of the real and imaginary parts), will result in a LUT of 256×10242×10242×8×16 ≈ 36 000
 terabits. Even with modern computers it is impractical, if not impossible, to set aside memory with size in the order of astronomical terabits for the LUT.
The memory problem can be alleviated with a hybrid approach, with some of the data being computed instead of storing in the LUT. A smaller LUT is constructed to store the values of the FZP function fzp(m−mp,n−np;zp) for all combinations of values of the five variables {m,n,mp,np,zp}
 . The hologram pixel of an object point can be computed by multiplying its intensity Ap
 with the retrieved value from the LUT, as shown in the flowchart in Figure 2.2. The size of the LUT will be decreased dramatically from 35 840 terabits to around 140 terabits, at the expense of increasing the computation loading with (M×N×P)
 multiplications. Even with the reduction in the size of the LUT, the memory requirement is still astronomical. In the subsequent subsections, different methods for trading off the size of the LUT and the speed enhancement in generating a hologram will be described.

Figure 2.2 Flowchart for generating a hologram pixel with a smaller LUT.
2.4 Novel Look-Up Table Method
As mentioned in Section 2.3, the basic LUT method requires precomputation and storage of the FZP for all the combinations of the six variables {Ap,m,n,mp,np,zp} , resulting in a LUT of formidable size even for a small hologram. Although the size of the LUT can be reduced by discarding the intensity parameter Ap
 , the amount of computer memory is still enormous. The novel look-up table (N-LUT) method was proposed in [2], with the objective of further reducing the size of the LUT. A closer look at the function fzp(m−mp,n−np;zp)
 reveals that it is simply a translation of the FZP fzp(0,0;zp)
 of a point source located at an axial distance zp
 from the hologram plane. Refer to Figure 1.14 on a layered partitioning of the object space. For each depth plane at zj
 , a function fzp(0,0;zj)
 , which is referred to as the principal fringe pattern (PFP) is defined. Based on the PFP, the FZP of object points at other locations, fzp(m−mp,n−np;zp),
 can be derived by translating the PFP. It is then sufficient to store the PFP for each depth plane in a small look-up table known as the N-LUT.
The construction of the N-LUT and its application in generating a hologram pixel from an object point are shown in Figure 2.3. Suppose the object space is divided into D depth planes within the range [z1,zD]
 , a set of PFP functions (PFP1 to PFPzD
 ) is computed and stored in the N-LUT. To compute a hologram for a 3-D object, each depth plane is visited one by one. In each depth plane, the corresponding PFP is retrieved from the N-LUT. For an object point located at (mp,np)
 on the jth depth plane and having intensity Ap
 , the PFP of the depth plane at zj
 is shifted to the position (mp,np)
 . The translated PFP is then multiplied by Ap
 and accumulated on the hologram. This process is repeated for all the object points in the set of scan planes, resulting in a hologram of the 3-D object space.

Figure 2.3 The N-LUT method.
Compared with the LUT method, the number of major arithmetic operations is slightly larger as the diffraction pattern of each object point is obtained by translating the PFP along the horizontal and vertical directions. Since the computation loading of these additional processes is negligible in practice, the overall complexity of the N-LUT method is about the same as that of the LUT method, comprising of (M×N×P) multiplications and an equal number of addition operations. However, the size of the N-LUT is substantially reduced to (M×N×D×B)
 bits, which is M×N
 times smaller than that in the LUT. Referring to the previous example, the size of the N-LUT for M=N=1024
 , D=8
, D=8 , and B=16
 bits (2 bytes) is 1024×1024×8×2 ≈ 16.8
 megabytes. Reducing the size of the N-LUT by taking into account the pixel size and the reconstruction distance of the digital hologram was conducted and reported in [3].
2.5 The Line Scanning Method
Although the N-LUT is relatively smaller in size than the LUT, it still requires quite a lot of computer memory to store. To alleviate the memory requirement, Z. Yang has proposed the line scanning (LS) method [4] to further reduce the size of the N-LUT. As mentioned in Section 2.4, an N-LUT has to store a complete image of the PFP for each of the depth planes, resulting in a LUT of (M×N×D×B) bits. A PFP is an FZP in the form of concentric circular rings centered at the origin. Adopting polar coordinates, the location at (x,y)
 can be expressed as x=rcosΘ
 , y=rsinΘ
 , where r
 and Θ
and Θ are the radius and azimuth of the hologram plane. The FZP at depth plane zj
 can be rewritten in the polar form as
 (2.7)
(2.7) From the right-hand side of Eq. (2.7), it can be seen that the value of the function fzp(r,Θ;zj) is only dependent on the radius. If the radius is uniformly discretized into RN
 intervals, there will only be RN
 different values for the 1-D function G(r;zj)
 , with which the PFP on the corresponding depth plane can be generated. A LUT of size (RN×D×B)
 will be sufficient to encapsulate the PFPs of all the depth planes. Suppose the radius RN
 of an FZP (which is half the width or height of a square hologram) is 512
 , the memory required to store the PFPs of a 3-D object scene with eight depth planes is (RN×D×B)=512×8×2 ≈ 8
 k bytes, which is about 2000 times smaller than that required to store the N-LUT.
In computing the hologram, a scan line is retrieved for each object point and used to reconstruct the PFP for Θ=[0,2π) . A straightforward implementation is to compute each point of the PFP as
 (2.8)
(2.8) From Eq. (2.8), it can be seen that each quadrant of the PFP is in fact a mirror image of the others, that is:
 (2.9)
(2.9) 
Hence, computation of the PFP from the scan line can be simplified to the computation of the first quadrant of the PFP ( m;n≥0 ), and the remaining quadrants are obtained from the symmetrical relation in Eqs. (2.9) and (2.10). The process can be divided into three steps, as illustrated in Figure 2.4. In step 1, a scan line is generated. In step 2, the first quadrant of the PFP is computed from the scan line. Finally, in step 3, the remaining quadrants of the PFP are duplicated from the mirror images of the first quadrant.

Figure 2.4 The LS method for generating the PFP.
Expanding a radial line into a circular arc can be implemented with Bresenham’s line algorithm [5]. However, some of the pixels in the PFP may be missing. An improved method has been proposed in [6], whereby the “arithmetical circle algorithm” [7] is used to generate the PFP from the scan line.
2.6 The Split-Look-Up-Table (S-LUT) Framework
Another method of reducing the size of the LUT, known as the split-look-up-table method (S-LUT), was proposed by Y. Pan et al. [8]. Previous LUT methods are more or less based on storing the FZP function in its original form. The S-LUT method employs an approximation of the FZP that is formed by the product of a pair of 1-D functions. The hologram is generated by accumulating the approximated FZP function of each object point. Referring to Eq. (2.1), the FZP of the pth point in the object space is a function of five variables {m,n,mp,np,zp} . By grouping the pairs of terms {m,mp}
 and {n,np}
 , the FZP can be simplified as a function of three variables
 (2.11)
 where Δm=(m−mp) and Δn=(n−np)
 . The hologram H(m,n)
 can be rewritten as

As Δm2=|Δm|2 and Δn2=|Δn|2
 ,
,
 (2.13)
 Assuming |Δmδd|≪zp and |Δnδd|≪zp
 , Eq. (2.13) can be approximated as
 (2.14)
 Eq. (2.14) can be rewritten as
 (2.15)
 where OH(|Δm|;zp)=exp[i2πλ−1|Δm|2δd2+zp2] is the horizontal light modulation factor and OV(|Δn|;zp)=exp[i2πλ−1|Δn|2δd2+zp2]
 is the vertical light modulation factor. Both factors can be precomputed in advance and stored in the computer memory. In the generation of the hologram, the pair of functions are fetched from the memory based on values of |Δm|
 , |Δn|
 , and zp
 . The remaining calculations will be the product of intensity Ap
 with the pair of retrieved functions for each object point, and the summing of the holographic signals for all the object points.
Without loss of generality, the pixel size of the object and hologram spaces are assumed to be identical, and both spaces have horizontal and vertical extents of M rows and N columns. The size of the LUTs for a single depth plane are M for OH(|Δm|;zp)
 and N
and N for OV(|Δn|;zp)
 (where 0≤|Δm|<M
 and 0≤|Δn|<N
 ). However, since the computation of both light modulation factors is the same, only a single LUT is needed. Assuming a square hologram ( M=N
 ), this results in a LUT with M
 entries, which is much less than that required in the early LUT method. The size of the S-LUT for multiple plane will be multiplied by the number of depth planes that are used to discretize the 3-D object along the axial direction. The memory size of the S-LUT for each depth plane of a 1024×1024
 hologram, with each entry of the S-LUT represented with 16 bits, is 1024×16 ≈ 16
 kbits.
Generation of a hologram pixel at location (m,n) for a single object point with the S-LUT method is summarized in Figure 2.5. Given an object point at position (mp,np;zp)
 , the horizontal and the vertical light modulation factors are retrieved from the LUTs. The pair of light modulation factors is then multiplied with the intensity Ap
 of the object point to generate the hologram pixel.

Figure 2.5 Computing a hologram pixel with the S-LUT method.
2.7 Compressed Look-Up-Table Method
The total size of the S-LUT for handling a 3-D object is equal to the number of entries of the S-LUT for a single depth plane, multiplied by the number of depth planes. This will lead to the use of a huge amount of computer memory if the number of depth planes is large. The compressed look-up-table (C-LUT) method [9] was developed by J. Jia et al. for reducing the size of the S-LUT at the expense of increasing the amount of computation, and adding extra restrictions on the depth range of the object space. The reconstructed image of a Fraunhofer hologram is similar to that of a Fresnel hologram, so that the hologram of a 3-D object comprising P object points can be derived from the Fraunhofer, instead of the Fresnel, diffraction as
 (2.16)
 Assuming that the thickness of the 3-D object is considerably smaller than the mean distance zμ between the object, Eq. (2.16) can be rewritten as
 (2.17)
 where L(m,n;zp)=exp[iπλ−1zp−1δd2(m2+n2) ] is the longitudinal light modulation factor, OH'(m,mp)=exp[−i2πλ−1zμ−1δd2(m×mp)]
 is the horizontal light modulation factor, and OV'(n,np)=exp[−i2πλ−1zμ−1δd2(n×np)]
 is the vertical light modulation factor.
By replacing zp with zμ
 in the horizontal and vertical modulation factors, only the longitudinal light modulation factor is dependent on the distance of the depth plane. If L(m,n;zp)
 is obtained through computation instead of storing in the computer memory, a smaller LUT (which is referred to as the C-LUT), will be sufficient to store the pair of light modulation factors for all the combinations of values of (m,mp)
 and (n,np)
 . For a square hologram, the overall size of the C-LUT is M2.
 On the downside, the thickness of the object space has to be sufficiently small, and derivation of the longitudinal light modulation factor increases the computation loading as compared with the S-LUT method.
The process of applying the C-LUT method to generate a hologram pixel from an object point is shown in Figure 2.6. First, the horizontal and vertical light modulator factors for each object point are fetched from the computer memory. Next, the product of the pair of light modulator factors, together with the depth-dependent longitudinal light modulator factor and the intensity of the object point, are computed. The hologram is obtained from the sum of the diffracted waves of all the object points. Subsequent to [9], further reduction in the size of the C-LUT by two times has been achieved with the accurate compressed look-up-table (AC-LUT) method in [10].

2.8 Wavefront Recording Plane Method
The hologram-generation methods described in previous sections have assumed that the light wave of each object point is recorded on the entire hologram plane. For a single object point, its hologram will be an FZP that is bounded by the perimeter of the hologram. In practice, due to the finite resolution of a digital hologram, the diffraction angle is limited to θmax=sin−1[λ/(2δd)] , where λ
 is the wavelength of light and δd
 is the pixel size of the digital hologram. Taking this into account, the hologram should only record the part of the FZP that is within the area covered by the maximum diffraction angle of the object point, as shown in Figure 2.7. Furthermore, the closer the distance between the hologram and the object point, the smaller will be the coverage of the light beam of the object point. This is in line with the notion of a virtual window in [11], where only a small region of the hologram is computed for each object point, resulting in a significant reduction of the computational load.

Figure 2.7 Spatial relation between the object space, the WRP, and the hologram.
A more formal adoption of the concept of a virtual window in hologram generation was proposed by T. Shimobaba et al. in [12]. A hypothetical plane known as the wavefront recording plane (WRP) is placed close to the object space. Each object point emits a cone of light wave with an aperture that is limited by the maximum diffraction angle θmax . The directrix of the cone on the WRP is the perimeter within which the FZP of the object point needs to be computed. A side view of the hologram, the WRP, and three object points is shown in Figure 2.7. Each object point is projecting a small FZP on the WRP, and it can be seen that the size of the FZP is inversely proportional to the distance between an object point and the WRP. The WRP is in fact a hologram that is at near proximity to the object wave. After the diffractive waves of all the object points have been computed on the WRP, the latter is expanded to a full hologram on the hologram plane. The mechanism is similar to the generation of a H2 hologram, with the WRP being the first hologram, which is copied to a second hologram at a farther distance.
Details of the WRP method in generating a hologram can be divided into two major stages.
Stage 1
Referring to Figure 2.7, each object point casts a small FZP on the WRP plane that is bounded by the circular directrix of the cone of light wave. However, to simplify the software implementation, the circular region can be replaced with a square support. The side length of the square support, denoted by τ , is equal to the diameter of the directrix. The object wave, the support of the pth object point on the WRP, and the distance between the object point and a pixel at (m,n)
 on the WRP are denoted by W(m,n)
 , Sp
, Sp , and rm;n;p
 , respectively. The FZP within the support Sp
 corresponding to the pth object point is given by

The object wave on the WRP is the sum of the FZPs of all the object points:
 (2.19)
 As the support Sp is a small square, the computation involved in stage 1 is significantly lower than that required for computing the hologram directly with Eq. (2.1).
Stage 2
After the WRP is generated, it is projected onto the hologram with the Fresnel diffraction equation given by
 (2.20)
 where zwrp is the distance between the WRP and the hologram, and h(m,n;zwrp)
 is the free space impulse response in Fourier optics. To further speed up the computation, the convolution operation in Eq. (2.20) can be implemented in the Fourier space as
 (2.21)
 As the Fourier transform of h(m,n;zwrp) can be precomputed, Eq. (2.21) can be implemented with a multiplication, a forward Fourier transform, and an inverse Fourier transform operation. All three operations can be swiftly conducted in less than 10 ms with a commodity GPU device. With the use of a LUT [13] for storing precomputed values of wp(m,n)
 for all combinations of {m,n,Ap,rp}
 , a 2048×2048
 hologram representing 3×10⁴
 object points can be generated with the WRP method at around 10 frames per second.
Simulation on generating a hologram with the WRP is conducted with MATLAB code in Section 2.11.1. As before, the object space is the double-depth image in Figure 1.12. The spatial relation between the double-depth image, the WRP, and the hologram is shown in Figure 2.8. From the figure, it can be seen that the object space is quite near to the WRP, with the left and the right sides of the image at axial distances of z0=0.01 m and z1=0.02 m
 from the WRP. The separation between the WRP and the hologram is zwrp=0.06 m
 . The length τ
 of the square support is set to 64.

Figure 2.8 Spatial relation between the double-depth image, the WRP, and the hologram.
After running the MATLAB codes, the real and the imaginary components of the object wave on the WRP are shown in Figures 2.9(a) and 2.9(b). The real and imaginary components of the hologram are shown in Figures 2.9(c) and 2.9(d), and the reconstructed images are shown in Figures 2.9(e) and 2.9(f). The time taken to generate the hologram with the WRP method is about five times less than the direct point-based method in Section 2.1, but the reconstructed image of each character on its focused plane is similar to the original ones in Figure 1.12.

Figure 2.9 (a) Real component of the object wave on the WRP. (b) Imaginary component of the object wave on the WRP. (c) Real component of the hologram. (d) Imaginary component of the hologram. (e, f) Reconstructed images of the hologram, at depth planes 0.07 m and 0.08 m, respectively.
From Eqs. (2.18) and (2.19), it can be seen that the time taken to compute the WRP signal is directly proportional to the number of object points. As such, the time taken to generate a hologram can be rather lengthy for a dense object space. Further reduction of the computation time can be achieved by decreasing the number of object points through downsampling. This method is referred to as the downsampled WRP (DS-WRP) method. To illustrate this, a simulation is conducted using MATLAB code in Section 2.11.2. The program is similar to that of the WRP method in Section 2.11.1, with the exception that the object space is downsampled by a factor of DS = 8 along both the horizontal and vertical directions to reduce the number of object points. After running the program on the double-depth image in Figure 1.12, the object waves on the WRP and the hologram are shown in Figure 2.10(a–d). The reconstructed images of the hologram on the two focused planes are shown in Figures 2.10(e) and 2.10(f).

Figure 2.10 WRP method with downsampling the source image with DS = 8. (a) Real component of the object wave on the WRP. (b) Imaginary component of the object wave on the WRP. (c) Real component of the hologram. (d) Imaginary component of the hologram. (e, f) Reconstructed images of the hologram, at depth planes 0.07 m, and 0.08 m, respectively.
A fast WRP method that does not require the use of LUTs has been demonstrated in [14]. In this approach, a small FZP of each object point is computed with a fast algorithm, hence saving the large amount of computer memory that is used in storing the LUT. Another fast method has been proposed in [15,16], whereby the wavelet transform is employed to reduce the amount of computation. Later, the WRP method was extended to generate color holograms [17], as well as holograms that are smaller than the object images with the use of shifted-Fresnel diffraction [18].
The WRP approach has two major disadvantages. First, in order to speed up the hologram-generation process, the number of object points should be reduced. This can be achieved by downsampling the intensity image of the object scene, resulting in a sparse image of degraded quality. Downsampling also imposes aliasing error on the image, especially regions with high spatial frequency content. Although aliasing error can be lowered by limiting the bandwidth of the image, the lines and edges pattern will be blurred. On the other hand, if the downsampling factor is small, more object points will be included and the computation time of hologram generation will be increased accordingly. The second problem is that the separation between the WRP must be close to the object points, so that the support Sp is small for all the object points. This is important for the WRP method as the computation time, as depicted in Eq. (2.18), is proportional to the size of the support. In another words, in order to maintain the computation efficiency of the WRP method, the thickness (depth range) of the object must be small. This problem has been addressed with the double WRP [19] and multiple WRP methods [20–22]. In these approaches, the object space is partitioned into two or more narrow zones along the axial direction. A WRP is assigned to each zone to record the diffraction patterns of its constituting object points. The hologram is generated by summing the optical waves from the WRPs of all the zones. Including more WRPs lengthens the time taken to generate the hologram, and hence degrades the computational efficiency. An alternative WRP method, known as the tilted WRP method [23], is also effective in generating holograms of deep structure object scenes.
2.9 Interpolated WRP Method
As mentioned in Section 2.8, the WRP method faces the dilemma of trading off image quality with computational efficiency. The interpolated WRP (IWRP) method [24] was developed to alleviate this problem. The concept of this method is to generate the diffracted pattern for a small region of points instead of individual ones. The process can be divided into three steps.
Step 1
The object space and the WRP are first uniformly divided into non-overlapping square blocks of size τ×τ . For each block in the object space (which is indexed with the variable j), its pixels are assigned the mean amplitude μa;j
 and mean depth values μd;j
 (with reference to the WRP) of its constituting pixels. If μa;j>0
 , the partition is referred to as a “non-empty partition.” An identical area (i.e., the same size and at the same horizontal and vertical positions) is partitioned on the WRP plane for each of the square blocks on the object space. The area bounded by the jth square block, which is identical for both the object space and the WRP, is referred to as the support, and denoted with the symbol Sj
 . It can be inferred that this mechanism is equivalent to downsampling, and subsequently interpolation of the object space. In downsampling, each partition is reduced to a single sample point carrying the mean amplitude and mean depth value of the object points in it. In interpolation, all the pixels within the partition are duplicated from the sample point. The diffraction fringe pattern wj(m,n)
 on the WRP corresponding to the jth block (i.e., support Sj
 ) is given by
 (2.22)
 where rm;n;p is the distance between the pth object point in Sj
 , and a pixel at location (m,n)
 within the support Sj
 on the WRP. From the expression on the right-hand side of Eq. (2.22), wj(m,n)
 is in fact the hologram of the jth square block of pixels in the object space. Similar to the WRP method, a LUT can be constructed to store precomputed diffraction patterns of the small blocks for different combinations of μa;j
 and μd;j
 .
.
Step 2
After the hologram fringe patterns of all the non-empty partitions have been derived with Eq. (2.22), the holographic image on the WRP will be formed by the union of the fringe pattern of individual partition as
 (2.23)
 where T is the number of non-empty partitions. As the WRP now contains the fringe patterns of an interpolated object image, it is renamed as the interpolated WRP. At first sight, it seems that Eq. (2.23) is similar to Eq. (2.19). There is no arithmetic operations in Eq. (2.23) and a union of the fringe patterns, which only requires a negligible amount of computations, is conducted instead. With the IWRP approach, the generation of a 2048 × 2048 hologram at a video rate of 25 frames per second, comprising four million object points, is demonstrated in [24].
Step 3
The optical wavefront on the WRP is expanded to a hologram H(m,n)  that is parallel to it, and placed at a distance zwrp
 before it. Denoting F
 and F−1
 as the forward and inverse Fourier transform,
(2.24) 2.10 The Warped WRP Method
The WRP can be considered as a hologram that is very close to the object space. Due to the short distance, the optical wave of each object point will only cover a small area on the WRP, as shown in Figure 2.11. Any modification made to the WRP therefore only affects a small area of the object space. If the modification is an enlargement of a region on the WRP, it is equivalent to moving the object points (that are associated with that region) farther away from the WRP. The warped WRP (WWRP) method [25], which is applied in fast generation of holograms, is based on this principle. The upper part of Figure 2.11 shows an image plane containing a pair of characters, H and K, and a WRP that is at close proximity and parallel to the image plane. Both characters are equidistant to the WRP. Due to the short distance between the image plane and the WRP, the optical waves corresponding to each character on the WRP are roughly confined within the area enclosing the character (i.e., the dotted boundary on the WRP). If the diffraction pattern of the character H (i.e., the region highlighted in gray) is magnified, it will be equivalent to moving the character farther away from the WRP, as shown in the lower half of Figure 2.11.

Figure 2.11 Concept of the WWRP method.
The WWRP method can be divided into four stages, as depicted in Figure 2.12. The object scene is a 3-D surface represented by an intensity image I(m,n) . The object space is partitioned into J regions, each having its own depth from the hologram. Let Sj(m,n)
 and zj
 denote the pixel locations of the jth region, and the depth value of the region, respectively. In the first stage, each region is scaled by a factor aj
 , resulting in a new intensity image I′(m,n)
 . As will be explained later, the scaling factor aj
 is determined by the depth of its corresponding region. In the second stage, a WRP hologram of I′(m,n)
 is computed. The WRP is spatially partitioned into J regions, each corresponding to the pixel locations in Sj(m,n)
 . In the next stage, each area in the WRP is scaled by a factor 1/aj
 . In the final stage, the WRP hologram is converted into a hologram.

For simplicity, refer to the object space of the double-depth image shown in Figure 2.11. In this example, the object space is composed of a left region S0 containing the character H, and right region S1
 containing the character K. The principle can be extended to an object scene with over two image planes.
Stage 1
In the first stage, each region Sj in the intensity image is scaled by a factor aj
 along the horizontal and vertical directions. Determination of the scaling factor aj
 will be discussed later. The image after scaling is given by
 (2.25)
 In the example of Figure 2.11, S0 and S1
 are located at distances z0’=0.02 m
 and z1’=0.01 m
 from the WRP. The prewarped intensity image is assumed to be on the image plane S1
 , which is closest to the WRP. Applying the Fresnel diffraction equation, the WRP hologram of the prewarped intensity image is generated as
 (2.26)
 where h(m,n;z1′)=exp(i2πλ−1(mδd)2+(nδd)2+(z1′)2) is the free space impulse response, which can be approximated as

The WRP represents a planar image that is parallel to the hologram and the image I′(m,n) , hence all the pixels are equidistant to the hologram. Due to the close proximity of the WRP and the object space, the light wave cast by each region on the WRP is more or less confined within the area covered by the region. As such, the WRP can be considered as the union of WRP components each composed of the hologram fringes of individual regions:
 (2.28)
 In the example shown in Figure 2.10, there are only two regions.
Stage 2
For stage 1 it has been assumed that all the regions of the image I′(m,n) are at equal distance z1′
 to the WRP. However, the depth value of each region Sj
 should be zj′
 instead of z1′
 . In stage 2, the area corresponding to the region Sj
 on the WRP is enlarged by a factor aj
 , so that the actual depth of Sj
 can be recorded on the WRP. Applying the scaling factor 1/aj
 to the WRP hologram w(m,n)
 ,
,
 (2.29)
 Substituting Eq. (2.25) into Eq. (2.29), the jth region on the WRP is changed to
 (2.30)
Assigning z1′aj2=zj′ , Eq. (2.30) can be rewritten as
 (2.31)
 It can be seen from Eqs. (2.30) and (2.31) that by rescaling the part of the WRP corresponding to Sj by a factor aj2
 , and setting aj=z1’/zj’
 , the part of the WRP corresponding to Sj
 will be representing the region relocated to depth zj’
 from the WRP.
In the third stage, a new WRP hologram is composed from the union of the scaled WRP components:
 (2.32)
 Subsequently, the WRP hologram is projected onto the hologram plane, resulting in a hologram representing the object scene comprising all the regions S0 to SJ−1
 , each locating at its own depth from the hologram. The hologram H(m,n)
 is given by
 (2.33)
 The MATLAB code in Section 2.11.3 is used to demonstrate the WWRP method. The source image I(m,n) , having a size of 256×256
 , is shown in Figure 2.13(a). The image is divided into four regions [S0,S1,S2,S3]
 , each corresponding to a different depth from the hologram, as shown in Figure 2.13(b). The WWRP method is then applied to generate the hologram for the image I(m,n),
 with respect to the depth map in Figure 2.13(b). First Eq. (2.25) is applied to prewarp the image, resulting in a new image as shown in Figure 2.13(c). The size of each character is scaled down by a factor proportional to its distance from the hologram. The prewarped image is then converted into a digital Fresnel hologram on the WRP that is located at an axial distance of 0.015 m from the image. The real and the imaginary components of the WRP hologram are shown in Figures 2.13(d) and 2.13(e), respectively. The reconstructed image is similar to the source image, which is not shown here.

Figure 2.13 (a) Intensity of the source image. (b) Depth map of the source image. (c) Prewarped image. (d) Real component of the WRP hologram of the prewarped image. (e) Imaginary component of WRP hologram of the prewarped image.
Next, the WRP hologram is divided into four regions in accordance with the partitioning, as shown in Figure 2.13(b). In each region, the hologram fringes are warped with a factor aj|0≤j≤3 following Eq. (2.29). The real and the imaginary parts of the warped holograms are shown in Figures 2.14(a) and 2.14(b). As shown in the figures, the fringe patterns for the four characters have been rescaled according to their distances between the source image and the hologram. The reconstructed images at the four focused planes [0.020 m,0.025 m,0.030 m,0.035 m]
 are shown in Figure 2.14(c–f). It can be seen that all four characters have been reconstructed to their original size.

Figure 2.14 (a, b) Real and imaginary component of the warped WRP hologram of the prewarped image. (c–f) Reconstructed images of the hologram generated with the WWRP method at 0.020 m, 0.025 m, 0.030 m, and 0.035 m, respectively.
2.11 MATLAB Simulation
This section includes the MATLAB source codes that are employed to conduct the simulations of the methods reported in this chapter. A summary of the simulation programs (each identified by the name of its main function call) and their correspondence to previous sections are listed in Table 2.2.
Table 2.2 Summary of the simulation programs in this chapter
| Function name | Description of simulation | Associated sections |
|---|---|---|
| WRP | Computer-generated holograms with the wavefront diffraction plane (WRP) method | 2.8 |
| DS_WRP | Computer-generated holograms with the downsampled wavefront diffraction plane (DS-WRP) method | 2.8 |
| WWRP | Generating a hologram with the warped wavefront diffraction plane (WWRP) method | 2.10 |
In the simulation on the WRP and the DS-WRP methods, the source image is the double-depth image HK1.jpg, with the intensity and the depth map shown in Figure 1.12(a,b). The image is evenly divided into a left half-plane and a right half-plane containing the characters H and K, respectively. The left half-plane is located at a distance of 0.07 m from the hologram plane, while the right half-plane is placed farther away at 0.08 m.
Simulation of the WWRP method is based on the source image “ABCD,” which comprises four characters each located at a different axial distance from the hologram.
2.11.1 Simulation of Computer-Generated Hologram with the WRP Method
The object space is a double-depth image comprising a left section with the character H and a right section with the character K, which are located at 0.07 m and 0.08 m from the hologram plane, respectively. The WRP is parallel to, and at a distance of 0.06 m from, the hologram. A square support of 64 × 64 pixels is adopted in the computation. The MATLAB program, as shown in Table 2.3, has a main program “WRP” that loads the intensity of the double-depth image. The size of the WRP and the hologram are both set to twice that of the image. The function “Image_to_WRP” is called to compute the object waves on the WRP. Next, a Fresnel hologram is generated from the WRP with the function “WRP_to_hologram,” from which the pair of images are reconstructed on their focused planes, displayed, and saved.
Table 2.3 Generating a hologram with the WRP method
2.11.2 Simulation of Computer-Generated Hologram with the Downsampled WRP Method
The source code in Table 2.4 is used to generate a hologram with the DS-WRP method. The object space is a double-depth image comprising a left section with the character H and a right section with the character K, which are located at 0.07 m and 0.08 m from the hologram plane, respectively. The WRP is parallel to, and at a distance of 0.06 m from, the hologram. A square support of 64 × 64 pixels is adopted in the computation. The size of the WRP and the hologram are both set to twice the size of the image. First the main program “DS_WRP” loads the intensity and depth map of the double-depth image. After the image is loaded, the user is prompted to enter a downsampling factor, DS. The function “Image_to_WRP” is called, with which the intensity image is downsampled, and a WRP is generated from the downsampled image and its depth map. Next, a Fresnel hologram is generated from the WRP with the function “WRP_to_hologram,” from which the pair of images are reconstructed on their focused planes.
Table 2.4 Generating a hologram with the DS-WRP method
2.11.3 Simulation of Computer-Generated Hologram with the WWRP Method
The source code in Table 2.5 is used to generate the hologram of a multiple-depth object. The object space is a square image that is evenly partitioned into four sections, each occupying a corner of the image, and containing one of the four characters {A,B,C,D}. The four sections are located at 0.020 m, 0.025 m, 0.030 m, and 0.035 m from the WRP, which is parallel to, and at a distance of 0.06 m from, the hologram.
The distance between the prewarp image and the WRP is 0.015 m, which is nearer to the WRP than the actual distances of each section. As such, all the sections on the source image, as well as its hologram on the WRP, have to be prewarped and enlarged, respectively.
In the MATLAB simulation, the function “WWRP” loads the intensity of the source image, and the function “Prewarp_Image” is called to prewarp each section of the image according to its distance from the WRP. Next, the WRP is generated from the prewarped image. The size of the WRP is set to be identical to that of the image. Subsequently, the function “Warp_Hologram” is executed to enlarge the fringe pattern of each section of the WRP hologram, according to the distance between the corresponding section and the WRP. Finally, each section of the image is reconstructed at its focused distance from the WRP hologram, displayed, and saved.
Note that for the sake of simplicity, the simulation does not include the forward and backward conversion of the WRP to and from the hologram.
2.12 Summary
In this chapter, a number of fast methods for generating digital Fresnel holograms were introduced. For an object comprising a small number of depth planes, the layer-based method that is implemented in the Fourier space is preferred for fast generation of its hologram. The point-based method, on the other hand, is more suitable for generating objects with a large number of object points that are scattering over a wide range of distances from the hologram plane. To increase the speed of hologram generation with the point-based method, different variants and sizes of LUT algorithms to trade-off computation time are described.
In the second part of the chapter, a number of methods based on the concept of the wavefront recording plane (WPR) are presented. Being different from the LUT approach, the WRP methods speed up the hologram-generation process through simplifying the hologram-formation process.Instead of generating the full hologram for each object point, only a small area of fringe patterns is computed on a WRP that is at close proximity to the object space. The computation time, therefore, is substantially reduced. Further enhancement on the computation speed is attained with the warped wavefront recording plane (WWRP) method. A 3-D object image is decomposed into a 2-D intensity image and a depth map. The intensity image is used to generate an interim hologram on a WRP. Different regions of the hologram fringes on the WRP are subsequently resized according to their distances (obtained from the depth map) from the hologram plane to generate a hologram from the WRP.
Exercises
E.2.1 Given λ=0.52 μm
 , δd=6.4 μm
 , and H_DIM =2048
 , perform a simulation with MATLAB to compare the computation time between generating a hologram of the double-depth image in Figure 1.12 with the layer-based method, based on (a) convolution, and (b) fast Fourier transform. From the results, evaluate the pros and cons of these two methods in the generation of digital Fresnel holograms.
E.2.2 Perform a literature study on reference [2], and write a MATLAB program to generate a digital Fresnel hologram of the double-depth image in Figure 1.12 with the N-LUT method.
E.2.3 Based on the MATLAB programs in Sections 2.11.1 and 2.11.2 that apply the WRP method to generate the digital Fresnel hologram of the double-depth image in Figure 1.12, evaluate the effects of the following parameters on the computation time, and the quality of the reconstructed images of the hologram.
a. Side length τ
 of the square support.
b. Distances z0
 and z1
 between the pair of depth planes and the WRP.
c. Downsampling factor on the intensity of the double-depth image.
E.2.4 Perform a literature study on references [19–22], and extend the MATLAB program in Section 2.11.2 to generate a digital Fresnel hologram of an image with four depth planes with the multi-depth WRP method. The intensity of the image is shown in Figure 2.13(a), and the axial distances of characters “A,” “B,” “C,” and “D” from the hologram are 0.06 m, 0.07 m, 0.25 m, and 0.26 m, respectively. The optical settings are given in E.2.1


