10 Advanced Topic: A Moon-Based Imaging of Earth’s Surface
Earth observation from remote sensing satellites orbiting in a low Earth orbit provides a continuous stream of data that can enable a better understanding of the Earth with respect to climate change [1]. Recently, the concept of observing the Earth from the Moon-based platform was proposed [2–4]. The Moon, as the Earth’s only natural satellite, is stable in periodic motion, making an onboard sensor unique in observing large-scale phenomena that are related to the Earth’s environmental change [5,6]. Synthetic aperture radar (SAR), an active sensor, provides effective monitoring of the Earth with all-time observation capabilities [7,8]. A SAR placed in the lunar platform was proposed [3], in which the configurations and performance of The Moon-Based SAR system was thoroughly investigated. Also, the concept of the Moon-based Interferometric SAR (InSAR) were analyzed by Renga and Moccia [4]. Later, the performance and potential applications of the Moon-Based SAR were characterized by Moccia and Renga [5], and the scientific and technical issues in the application of lunar-based repeat track and along-track interferometry in [6]. Following this stream of development, an L-band Moon-Based SAR for monitoring large-scale phenomena related to global environmental changes was discussed [9]. These studies are focused on the performance analysis and potential applications with some assumptions, such as a regular spherical Earth, an orbicular circular lunar orbit, a fixed earth’s rotational velocity, and a stationary Moon. By so doing, the SAR onboard Moon can be viewed as an inverse SAR (ISAR) or an equivalent sliding spotlight SAR [6,10].
10.1 RADAR MOON-EARTH GEOMETRY
The imaging of the SAR system depends on the relative motion between the earth target and Moon-Based SAR. In the relative motion, it is noted that the Moon revolves around the Earth with an average rotational velocity of 1023 m/s and a sidereal month of 27.32 days. The lunar orbit is elliptical, with an average semi-major axis of 384,748 km and an average eccentricity of 0.0549, which is close to a circular cycle. The lunar perigee is approximately 363,300 km, while the apogee can be up to 405,500 km. The angle between the lunar orbit plane and the Earth’s equatorial plane varies from 18.3° to 28.6°, with a period of 18.6 years [11]. Under a right-handed geocentric inertial reference frame (to be defined in the following section), with the Z-axis towards the North Pole and the X-axis pointing to the true equinox of the date, the radar Moon-Earth geometry is shown in Figure 10.1, where the lunar ascension and declination are designated by and the longitude and latitude of the ground target by . is the slant range at the beam center crossing time and is the grazing angle which determines the spatial coverage of the Moon-based SAR at a specified time. When the ascending node of the lunar orbit points to the true equinox of the date, the lunar declination reaches its maximum value under the same reference frame.
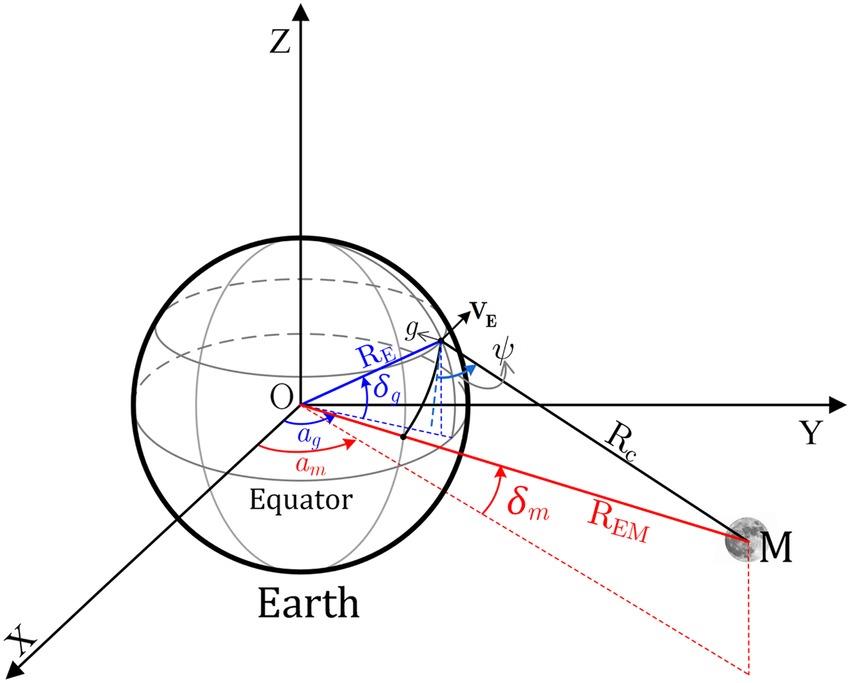
FIGURE 10.1 An unified right-handed geocentric inertial reference coordinate system for Moon-Based synthetic aperture radar (SAR), where point g represents the ground target, REM is the distance between the Earth and the Moon-Based SAR, which can be approximately regarded as the Earth and the Moon, and RE is the earth radius at point g (sketch not to scale).
10.1.1 TIME AND SPACE COORDINATES
To define the Moon-based SAR’s imaging geometry as shown in Figure 10.1, it is critical to obtain the accurate position vectors of the ground target and SAR system under a spatial reference system in a specified time coordinate [12,13]. The Barycentric Dynamical Time (TBD) is used for providing the coordinate time scale [14,15]. Then, the Moon-based SAR and ground target are mapped to the same reference frame through a series of coordinate conversions.
To uniquely describe the locations of the SAR system on the Moon’s surface and target on the Earth’s surface, we introduce four reference frames (see Figure 10.2):
- Moon-Centered Moon-Fixed Coordinate System (MCMF): The MCMF is used for providing the location of the SAR system on the lunar surface. It is a right-handed reference frame where the x-axis extends from the Moon’s center to the mean Earth direction. The z-axis points to the mean rotational pole of the Moon.
- Moon-Centered Inertial Coordinate System (MCI): The origin of the MCI is defined as the Moon’s center with the z-axis along the direction of the celestial north and the x-axis toward the vernal equinox. The y-axis obeys a right-hand rule.
- Earth-Centered Inertial Coordinate System (ECI): This is a right-handed reference frame and is served to describe the location of the Moon along its orbit. In the ECI, its origin is located at the Earth’s center, with the x-axis pointing to the vernal equinox and the z-axis pointing to the celestial north.
- Earth-Centered Rotational Coordinate System (ECR): The ECR is a right-handed reference frame; it is also known as the conventional terrestrial system. The origin of the ECR is Earth’s center. The x-axis is directed toward the Greenwich Meridian. The z-axis points to the North Pole of the Earth.
- Earth-Centered Inertial Coordinate System (ECI): This is a right-handed reference frame and is served to describe the location of the Moon along its orbit. In the ECI, its origin is located at the Earth’s center, with the x-axis pointing to the vernal equinox and the z-axis pointing to the celestial north.
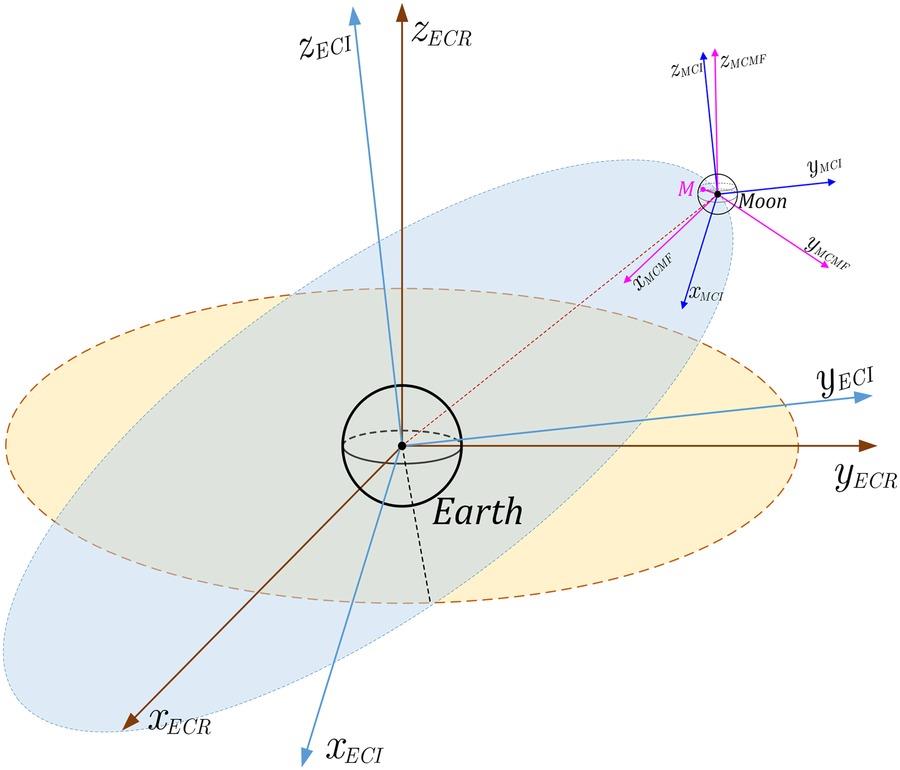
FIGURE 10.2 The definitions of the reference frames, where ‘M’ represents the site of the Moon-based SAR on the lunar surface. For the sake of clarity, this diagram is not to scale.
The position vector of the SAR system on the Moon’s surface in the ECI can be determined by [5]
where and are the position vector of the SAR system in the MCMF and that of the Moon’s center in the ECI, respectively. Generally, can be obtained from the lunar ephemeris. , the coordinate transformation matrix from the MCMF to MCI, is defined as [16]
where , , and are three auxiliary angles assigned to describe the libration of the Moon [17]. , , and are rotation matrices about the x-, y-, and z-axes, respectively.
Then, the position vector of the Moon-based SAR in the ECR is acquired through the following transformation [18,19]
with the transformation matrix expressed as
where matrices , , , and represent coordinate changes due to the precession, nutation, earth rotation, and polar motion, respectively. The transformations from the ECI to ECR are given next.
10.1.2 TRANSFORMATIONS FROM THE ECI TO ECR
The transformation from the ECI to ECR is achieved by Equation 10.4, where the matrix represents the coordinate change because of the precession and is given by [12]:
where , , and are all the auxiliary angles that describe precession in units of seconds. They are expressed as
where T is the Barycentric Dynamical Time (TDB) in Julian centuries from J2000.0 , , and , are rotation matrices about the x-, y-, and z-axes, respectively, explicitly given by
The transformation matrix from the mean equator and equinox of the Earth to the true equator and equinox of the Earth can be written as
where is the mean obliquity of the ecliptic, it can be expressed as follows
and in Equation 10.8 are the nutation in longitude and obliquity, respectively, and are, keeping the consistency with the DE430, given by
where is the mean longitude of the ascending node of the lunar orbit measured on the ecliptic plane from the mean equinox of date, it is
The matrix is related to the Earth’s self-rotation, which takes the form
with
where GAST represents the Greenwich Apparent Sidereal Time, GMST is the Greenwich Mean Sidereal Time, which can be obtained by
where and are given by
The time unit of and are Universal Time1 (UT1), which is another time scale [12].
Finally, the matrix related to the polar motion of the Earth is given by
where and are computed with an estimated linear correction in the DE430, as
where and are the rotations of the x-axis and y-axis at J2000.0, respectively. and are the linear corrections rates of and , respectively. They are
10.2 SPATIOTEMPORAL COVERAGE
Once the coordinate transformation is accomplished, the distance from the Earth to the Moon-based SAR (see Figure 10.1), nadir point’s latitude and longitude can be readily obtained, respectively, by
where are the coordinates of the Moon-based SAR in the ECR.
10.2.1 GEOMETRIC PARAMETERS
Since a specific site of the Moon-based SAR is yet to be determined, to proceed with analyzing the coverage on the Earth’s surface, the position of the Moon-based SAR is assumed to be the same as that of the Moon because of the extremely long distance from the Earth to the Moon. The relevant parameters for investigating the coverage are listed in Table 10.1.
TABLE 10.1
Parameters of the Moon-Based SAR in the ECR
| Symbol | Parameters | Symbol | Parameters |
| M | Site of Moon-based SAR | B | Nadir point |
| g | Ground target | Earth’s radius at g | |
| Earth’s longitude at g | Nadir point’s longitude | ||
| Earth’s latitude at g | Nadir point’s latitude | ||
| Earth–Moon-based SAR distance | Slant range of the Moon-based SAR | ||
| Linear velocity of the Earth’s rotation at g | Grazing angle | ||
| Geocentric angle | θel | Elevation angle | |
| ϕ | Azimuthal angle | Longitudinal deviation |
The geocentric angle, defined as the angle between the nadir point of the Moon-based SAR and the ground target referring to the Earth’s center, is
where is the longitudinal deviation and is defined as
The elevation angle that is the angle between the Moon-based SAR’s position vector and slant range vector is specified by
The grazing angle, the angle between the slant range and ground range plane, can be expressed as
The azimuthal angle, the angle between the slant range vector in the ground plane and velocity vector of the Earth’s self-rotation (eastward), takes the form
It should be noted that the direction of Earth’s self-rotation is used as a reference, represented by an azimuthal angle of 0°.
The slant range of the Moon-based SAR, is given by
Detailed derivations of Equations 10.22–10.25 are given in [19].
The geocentric and azimuthal angles, together with the grazing angle or elevation angle, determine the spatial coverage of a Moon-based SAR. Here, we choose the geocentric, azimuthal, and grazing angles to examine the Moon-based SAR’s spatial coverage.
From Figure 10.3, the grazing angle should be bounded by
where and are the lower and upper bounds of the grazing angle, respectively.
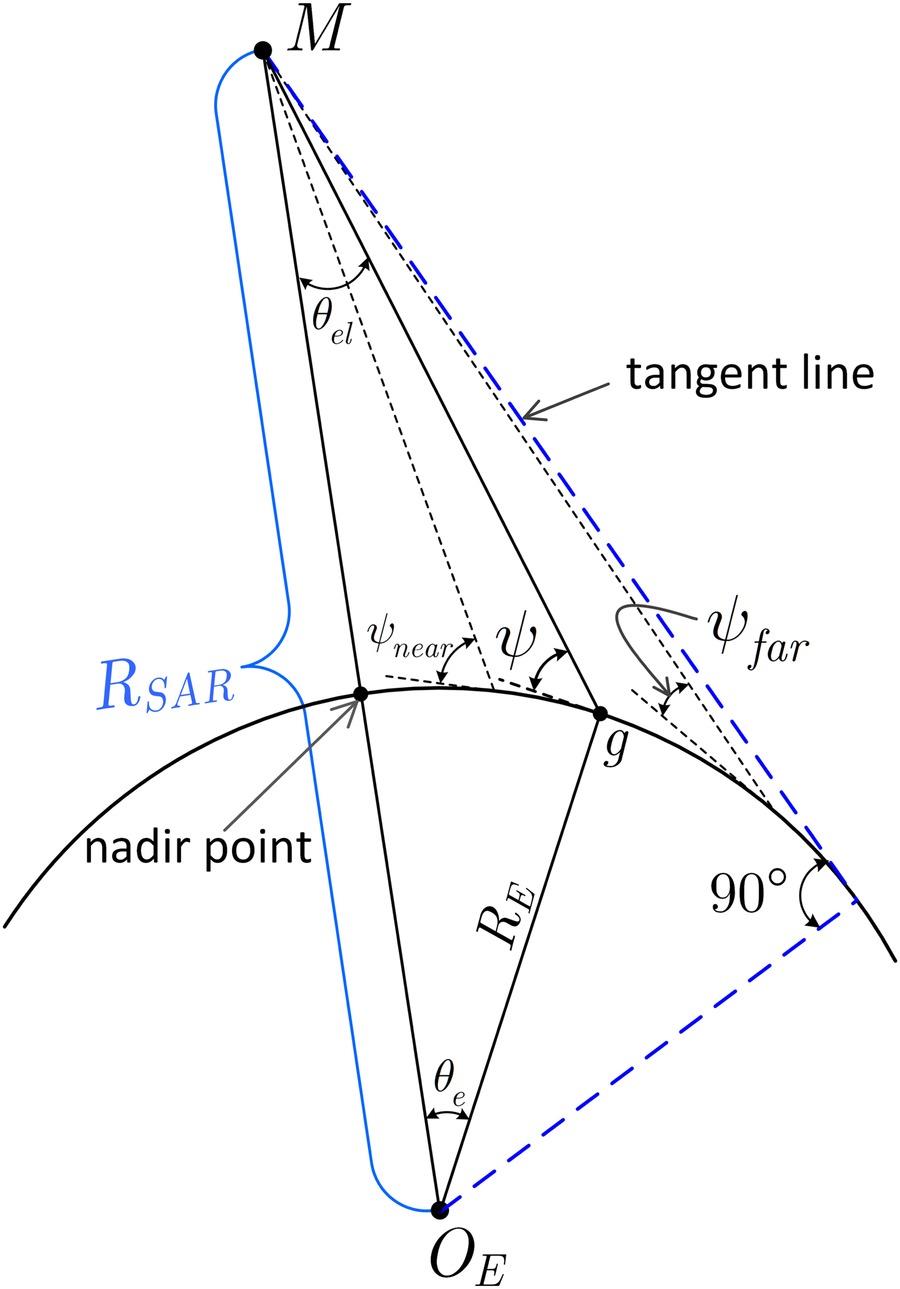
FIGURE 10.3 Illustration of and , the lower and upper bounds of the grazing angle, respectively (sketch not to scale).
Substituting Equation 10.25 into Equation 10.22 and imposing Equation 10.28, Equation 10.22 becomes
As far as the Moon-based SAR’s spatial coverage is concerned, the slant range in Equation 10.27 can be further approximated to
To confirm the validity of above equation in the context Moon-based SAR’s spatial coverage, a relative error is defined as
Figure 10.4 presents the relative errors at perigee and apogee of the lunar orbit in the domain. For the sake of simplicity but without loss of generality, the latitude of the Moon-based SAR’s nadir point is set to 0°, and the grazing angle is ranged from 0° to 90°. As detailed in Figure 10.4, the maximum value of the relative error is far smaller than 10‒3, which appears at the nadir point regardless of the distance from the Earth to the Moon-based SAR. This suggests that the approximation of the slant range in Equation 10.30 has little bearing on the dimensionless quantity, . In other words, the error induced by the approximation of the slant range can be reasonably ignored in determining the spatial coverage of a Moon-based SAR. However, we must compensate for this error given the rise in the image focusing. Accordingly, Equation 10.29 can be approximated by taking account of Equation 10.30 to
with
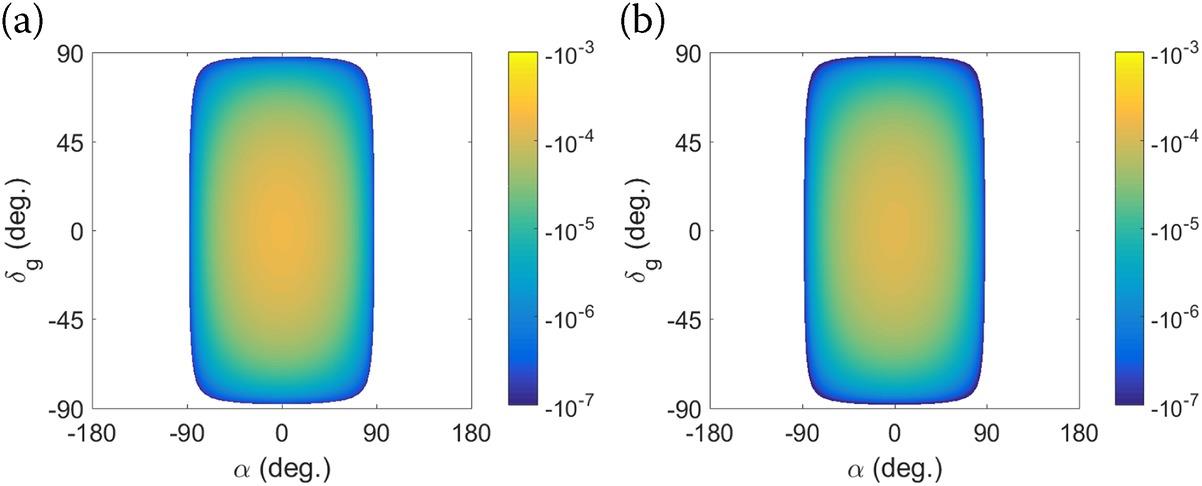
FIGURE 10.4 The relative errors in the domain at (a) perigee of the lunar orbit, (b) apogee of the lunar orbit.
Note that the ratio of Earth’s radius to Earth–Moon-based SAR distance is spatiotemporally varying as follows
where is the spatially varying component of the Earth’s radius at an arbitrary position on the Earth’s surface for the average Earth’s radius, ; is the temporally varying part of the Earth–Moon-based SAR distance at any time referring to the average distance from the Earth to the Moon-based SAR, . It can be calculated that is approximately 30 times larger than during one period of the lunar revolution. Thus, the spatially varying component of the Earth’s radius contributes little to Equation 10.34 (i.e., the ratio of Earth’s radius to Earth–Moon-based SAR distance). Hence, it is reasonably to accept a constant Earth’s radius (6371.0 km) here.
10.2.2 EFFECTIVE RANGE
Generally, a single antenna can observe a limited portion of the Earth’s surface in a given time frame. However, multi-antennas or antenna array can achieve the maximum extent of the spatial coverage by adjusting the pointing direction of each antenna. For example, the half-power beam width of a single antenna is [37]
where is the wavelength, is the aperture length, is the aperture-illumination taper factor for the antenna. Generally, a value of =1.5 is appropriate for an antenna with high beam efficiency. The spatial coverage of the Moon-based SAR is subject to the imaging geometry because the SAR system cannot have nadir imaging and it may perform poorly at large incident angles. Thus, the grazing angle should be limited to a valid range: The observed areas of the satellite SAR are commonly restricted within the range from 20° to 60° of incident angles, namely from 70° to 30° of grazing angles. Regarding the Moon-based SAR, the near and far grazing angles should be limited to a practical range for covering the globe within each cycle of the lunar revolution.
The far grazing angle is determined such that both the North and South Poles of the Earth are observable during one lunar revolution. By letting , the following relationship is readily obtained
Once the far grazing angle exceeds its upper bound, neither the North Pole nor the South Pole is covered by the Moon-based SAR wherever the nadir point is located. It is noted that even when the far grazing angle is bounded, the North Pole (or the South Pole) is not always observed by the Moon-based SAR. The observation of the North Pole (or the South Pole) is still subjected to the nadir point’s latitude, as will be evidenced in the next sub-section.
Similarly, the near grazing angle should satisfy the following relationship to cover the equatorial regions:
Note that only when the near grazing angle is larger than the lower bound can the equatorial regions of the Earth be observed during each cycle of the lunar revolution.
The inclination of the lunar orbit to the Earth’s equatorial plane stands at between 18.3° and 28.6° [20]; in other words, the maximum scale of the nadir point’s latitude varies from 18.3° to 28.6°. In Figure 10.5(a), we plot the bounds of the far grazing angle at apogee and perigee of the lunar orbit versus nadir point’s latitude. Then, bounds of the near grazing angle at apogee and perigee of the lunar orbit for the magnitude of the nadir point’s latitude are plotted in Figure 10.5(b). The range of latitude for the nadir point of the Moon-based SAR is 18.3° to 28.6°.
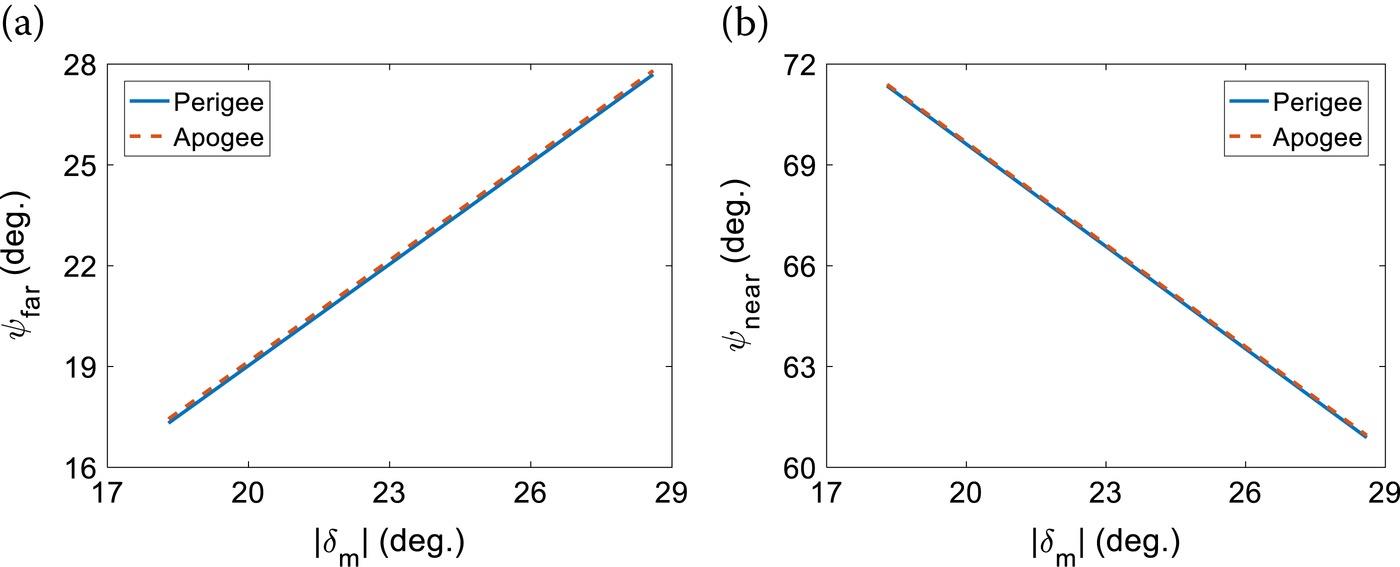
FIGURE 10.5 With the Moon located at the apogee and the perigee of the lunar orbit, (a) shows the upper bound of far grazing angle for covering the Earth’s Poles (Neither the North Pole nor the South Pole is observed when the far grazing angle is beyond the lines), and (b) shows the lower bound of near grazing angle for covering the equatorial regions; the equatorial regions will not be observed when the near grazing angle is below the lines.
Even though the spatial coverage is bounded by the near and far grazing angles, the image quality of the Moon-based SAR is still an issue. The Moon-based SAR system usually works in the squint mode when observing the bounded regions, which would lead to pixel skewing on the ground and raise a significant challenge to the image quality. Under the skewing effect, satisfactory imaging is only available when the iso-range and iso-Doppler profiles are relatively far from being parallel. Generally, the quasi-parallel regions of the iso-range and iso-Doppler contours occur at where the azimuthal angles are close to 0° or 180°. Therefore, it is practical to examine the spatial coverage of the Moon-based SAR by limiting the azimuthal angle, namely
where is the bound of the azimuthal angle; here we should set it to 30° to ensure the good image quality.
In Figures 10.6(a–d) we plot the iso-range and iso-Doppler profiles in the domain within the boundary set by Equation 10.38 with the Moon-based SAR locating at different positions listed in Table 10.2. The beam center crossing time is set to 00:00:00 without loss of generality.
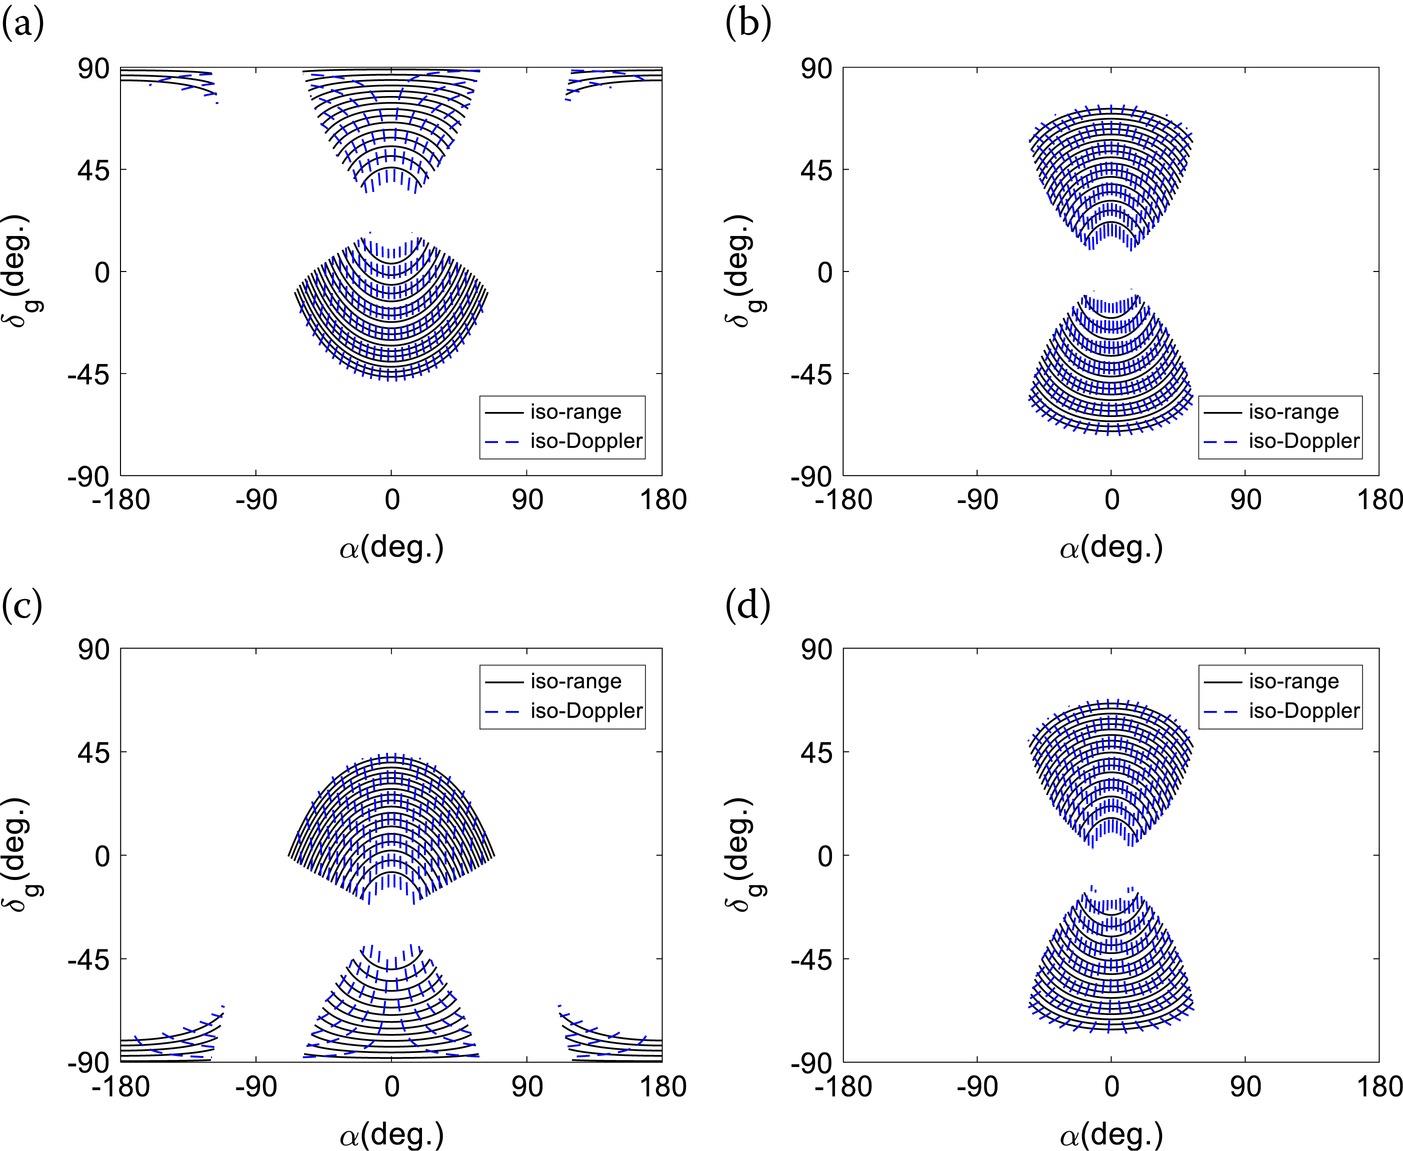
FIGURE 10.6 Iso-Doppler and iso-range profiles in the domain at 00:00:00 on (a) March 20, 2024, (b) March 25, 2024, (c) April 01, 2024, and (d) April 07, 2024.
TABLE 10.2
Coordinates of the Moon-Based SAR in the ECR at Different Times
| Coordinates Time | X(km) | Y(km) | Z(km) |
| Mar. 20, 2024, 00:00:00 | 221041.4734 | ‒289559.7324 | 167171.4715 |
| Mar. 25, 2024, 00:00:00 | 405558.5205 | ‒8874.6121 | 4569.0584 |
| Apr. 01, 2024, 00:00:00 | 74979.4046 | 330070.1283 | ‒183398.9317 |
| Apr. 07, 2024, 00:00:00 | ‒332302.4149 | 133331.8257 | ‒30492.2954 |
*The latitudes of the nadir point on Mar.20 and Apr.01 are close to the maximum and minimum values, while latitudes of the nadir point on Mar.25 and Apr.07 are approaching 0° of the latitude.
From Figure 10.6, the iso-Doppler and iso-range contours cut across each other wherever the Moon-based SAR is located. This suggests that the image quality is acceptable even when the Moon-based SAR system operates in a squint mode. Thus, the skewing effect exerts a little impact on the spatial coverage of the Moon-based SAR within the scope from Equation 10.38.
Finally, we can obtain the bounds of the geocentric angle that determines the Moon-based SAR’s spatial coverage as
where is the upper bound of geocentric angle, defined as
, the lower bound of geocentric angle is
where the threshold value is given by
Note that the upper bound of geocentric angle, related to the far grazing angle, determines the exterior boundary of the spatial coverage. In comparison, the lower bound of the geocentric angle is correlated to the near grazing angle and bound of the azimuthal angle. It decides the blind region that cannot be observed by the Moon-based SAR within the scope from the upper bound of the geocentric angle.
10.2.3 MOON-BASED SAR’s SPATIAL COVERAGE
Now, the spatial coverage of the Moon-based SAR can be examined in terms of the coverage area and ground coverage. To begin with, the coverage area of the Moon-based SAR within the bound of Equation 10.39 is detailed below.
Once the spatial coverage is limited to the range in Equation 10.39, the Moon-based SAR’s coverage area on the Earth’s surface can be approximated by [19]
with
Accordingly, the ratio of the Moon-based SAR’s coverage area to the global area can be written as
Detailed derivations of Equations 10.43 and 10.45 can be found in [19].
It follows that the coverage area on the Earth’s surface is related to the ratio of the Earth’s radius to the Earth–Moon-based SAR distance, the near and far grazing angles, and bound of the azimuthal angle. As the bounds of the grazing and azimuthal angles are ascertained in the preceding analysis, the coverage area of the Moon-based SAR depends only on the ratio of the Earth’s radius to the distance from the Earth to the Moon-based SAR.
Given the imaging geometry of the Moon-based SAR, the maximum ground coverage’s latitude occurs at 0° of the longitudinal deviation. Then, the maximum and minimum latitudes of the ground coverage can be obtained from Equations 10.39 and 10.40, as given by
By noting that the peak values of the Earth’s latitude are ±90°, a threshold for the nadir point’s latitude is defined
When the grazing angle of the Moon-based SAR is bounded by the far grazing angle, the coverages of the North and South Poles of the Earth are still pertinent to the latitude of the nadir point, threshold value , and opposite value of the threshold, .
In Figure 10.7, we plot the ground coverage of the Moon-based SAR at various latitudes of the nadir point (0°, −10°, 18°, and −28°) in the domain. The Earth–Moon-based SAR distance is set to 385,000 km, the average distance from the Earth to the Moon-based SAR; it can be calculated that the threshold for this distance is to 15.916°. As illustrated in Figure 10.7, there exist blind regions within the ground coverage bounded by the far grazing angle due to the effects of the near grazing angle and bound of the azimuthal angle. Besides, the longitudinal ground coverage is rotationally symmetric about the axis of , whereas the latitudinal ground coverage is asymmetric except the nadir point being at the Earth’s equator. Moreover, when the nadir point’s latitude is smaller than the threshold of , neither of the Earth’s Poles is covered by the Moon-based SAR. Meanwhile, the maximum size of the longitudinal deviation is always smaller than 90°. Regarding the Moon-based SAR’s nadir point whose latitude is larger than , such as in Figure 10.7(c), the North Pole is covered by the Moon-based SAR. However, the high latitudes in the southern hemisphere of the Earth cannot be observed. On the contrary, if the nadir point’s latitude is smaller than , the South Pole can be covered by the Moon-based SAR, but the high latitudes in the northern hemisphere are not. Under both conditions, the maximum longitudinal deviation can reach as large as 180°.
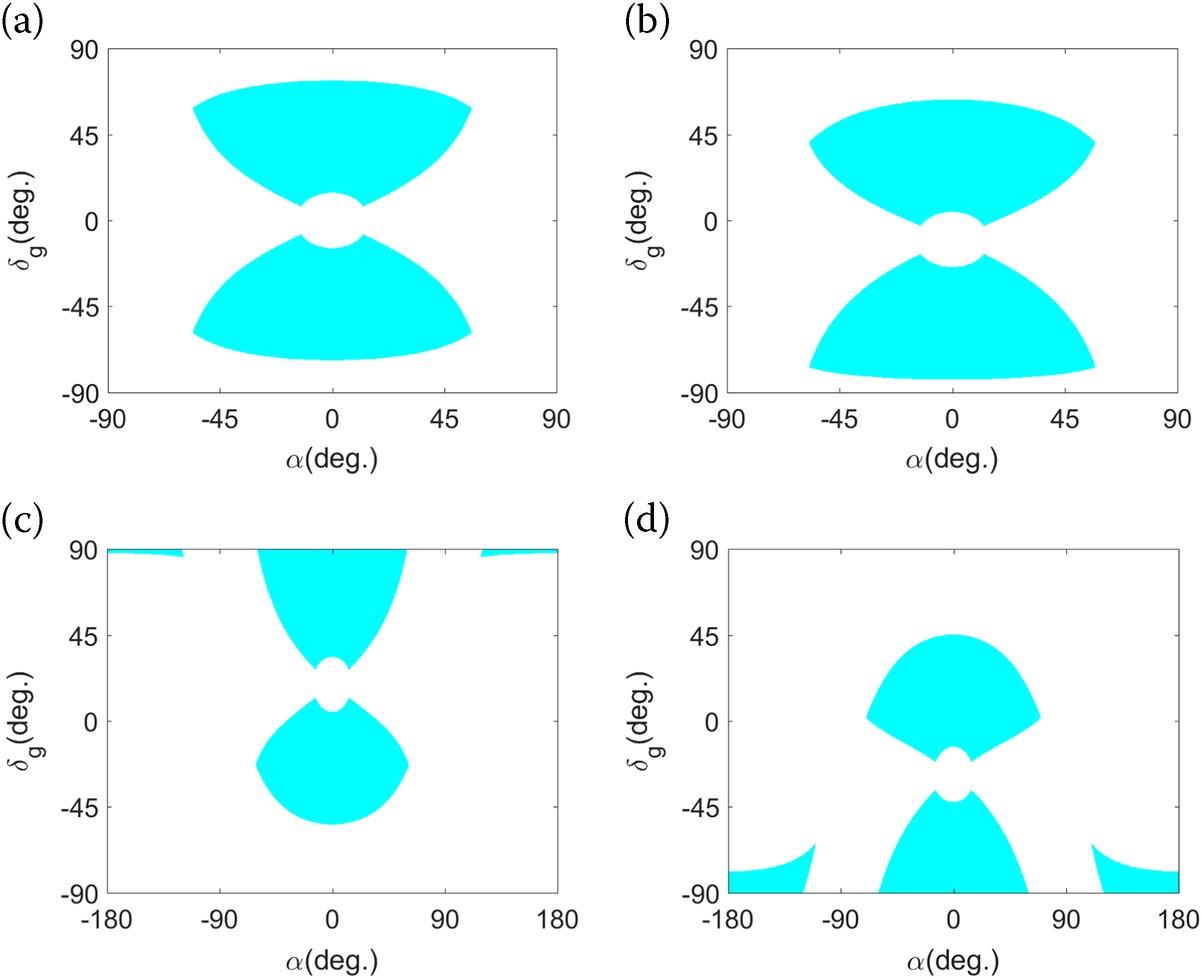
FIGURE 10.7 The Moon-based SAR’s ground coverage with an Earth–Moon-based SAR distance of 385,000 km at the nadir point’s latitude of (a) 0°, (b) −10°, (c) 18°, and (d) −28°.
10.2.4 TEMPORAL VARIATIONS IN THE SPATIAL COVERAGE
The spatial coverage of the Moon-based SAR is determined by the Earth–Moon-based SAR distance, bounds of grazing and azimuthal angles, and position of the nadir point at a specified time. The nadir point, which temporally varies, effectively induces the temporal variation in the spatial coverage. In what follows, the geographic coordinates of the nadir point, in light of the temporal variations are discussed.
The nadir point’s latitude and longitude are provided by Equations 10.20 and 10.21, both of which are a function of time and can be numerically obtained when the lunar ephemeris is applied. Now, the temporal variations in the latitude and longitude of the nadir point during one cycle of the lunar revolution are plotted in Figures 10.8(a) and (b), respectively.
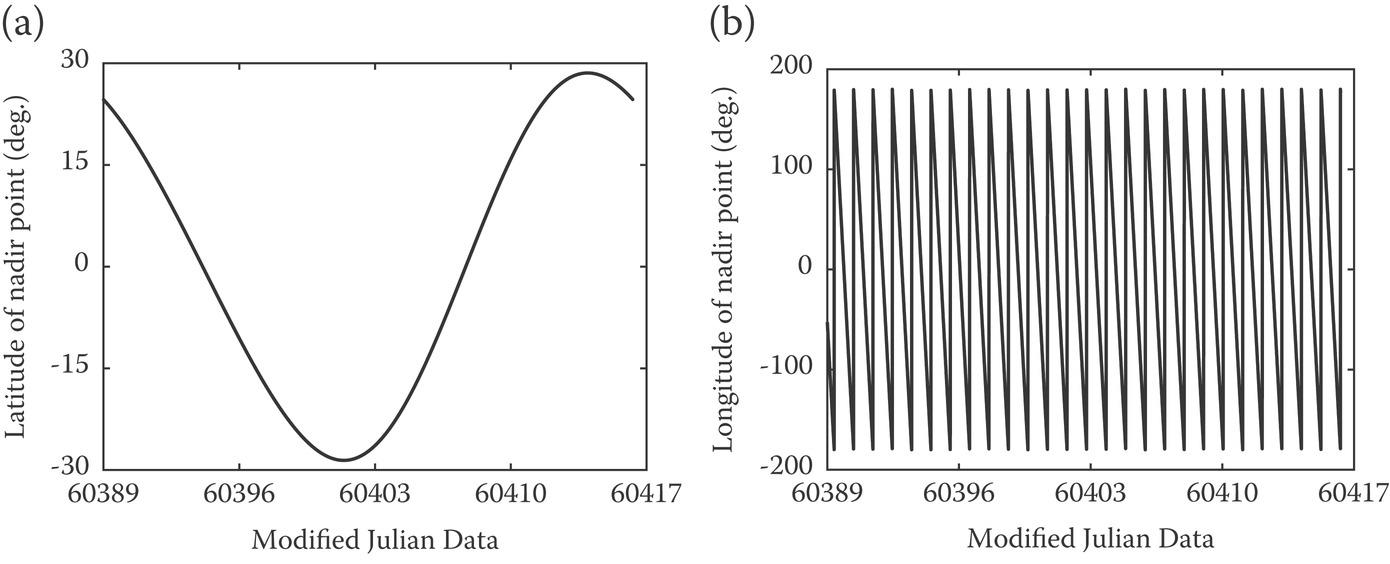
FIGURE 10.8 During one period of the lunar revolution, temporal variations in the nadir point’s (a) latitude and (b) longitude.
We see that the latitude of the nadir point is mainly determined by the lunar revolution. By comparison, the nadir point’s longitude is primarily decided by the Earth’s self-rotation. Furthermore, the nadir point’s longitude differs from that at the initial time after one period of the lunar revolution. This phenomenon is attributed to the Earth’s self-rotation and lunar revolution around the Earth. The temporal variation of the nadir point’s geographical coordinate is a continuous process. However, the temporal variation of the spatial coverage is not exactly equivalent to that of the nadir point. A time interval related to synthetic aperture, namely the synthetic aperture time, still needs to be considered in the imaging formation of the coverage region. A synthetic aperture time of 200 s can realize an azimuth resolution around 10 m, which is suitable for the Earth observation from the Moon-based SAR. Nevertheless, such a synthetic aperture time requires a large antenna with an aperture length in azimuth larger than 1000 m, which poses a significant challenge to build in practice. The sub-aperture imaging technique provides a feasible method to implement the desired synthetic aperture time without utilizing the large antenna [21]. Thus, the synthetic aperture time of the Moon-based SAR may be set to 200 s.
Figure 10.9 displays the track of the Moon-based SAR’s nadir point within one week, from which we observe the daily change of the nadir point’s latitude is relatively small (around 3°). The temporal variation of the longitude of the nadir point within one day can exceed 340°. Hence, the temporally varying nadir point, together with the extensive spatial coverage, leads the revisit time to be less than one day for most of the regions covered.
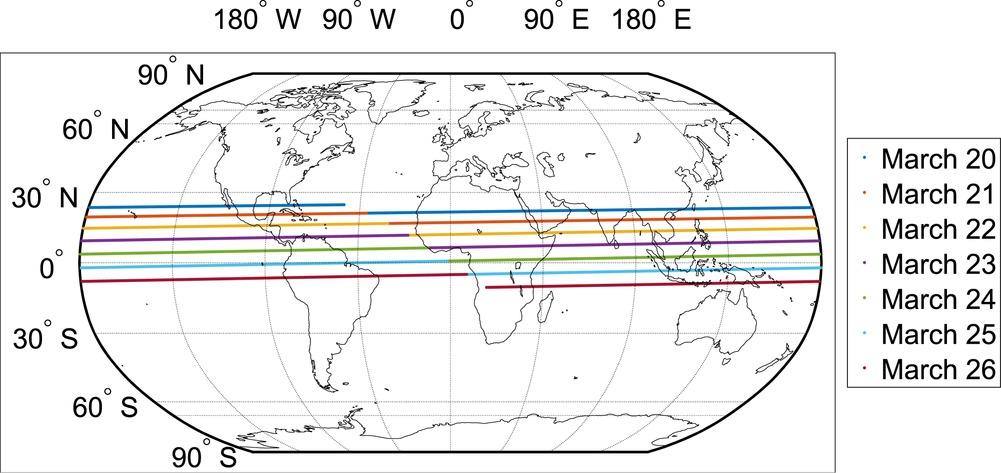
FIGURE 10.9 The track of the Moon-based SAR’s nadir point from March 20, 2024 to March 26, 2024. The synthetic aperture time is set to 200 s.
10.2.5 NUMERICAL ILLUSTRATION OF SPATIOTEMPORAL COVERAGE
Based on the lunar ephemeris from the DE430, numerical simulations are performed to visualize the spatiotemporal coverage of the Moon-based SAR. We begin by discussing the hourly variations in the spatial coverage of the Moon-based SAR within one day.
10.2.5.1 Hourly Variations
Assume that the initial visit time is 00:00:00 on March 20, 2024, when the nadir point’s latitude is relatively large. The hourly variations in the Moon-based SAR’s spatial coverage (eight-hour time intervals) within one day are plotted in Figure 10.10, where we see that most of the northern hemisphere of the Earth is measured by the Moon-based SAR, while the southern hemisphere of the Earth is less observed. Besides, it is understood that the spatial coverage moves from east to west and the revisit time of the covered region is commonly less than one day, implying that Earth’s self-rotation is a dominant factor in determining the temporal variation of the spatial coverage. Comparing Figure 10.10(d) with (a), we see that after a one-day lapse, the spatial coverage has moved to the east. This phenomenon is caused by the lunar revolution around the Earth. Moreover, it can be observed a large proportion of the Earth surfaces are viewed (e.g., South America is almost entirely covered by the Moon-based SAR at 00:00:00). Nevertheless, there are still blind regions within the coverage bounded by the far grazing angle. This suggests that the effects of the near grazing angle and bound of the azimuthal angle on the spatial coverage are significant. Hence, the spatial coverage is jointly determined by the near and far grazing angles and bound of the azimuthal angle.
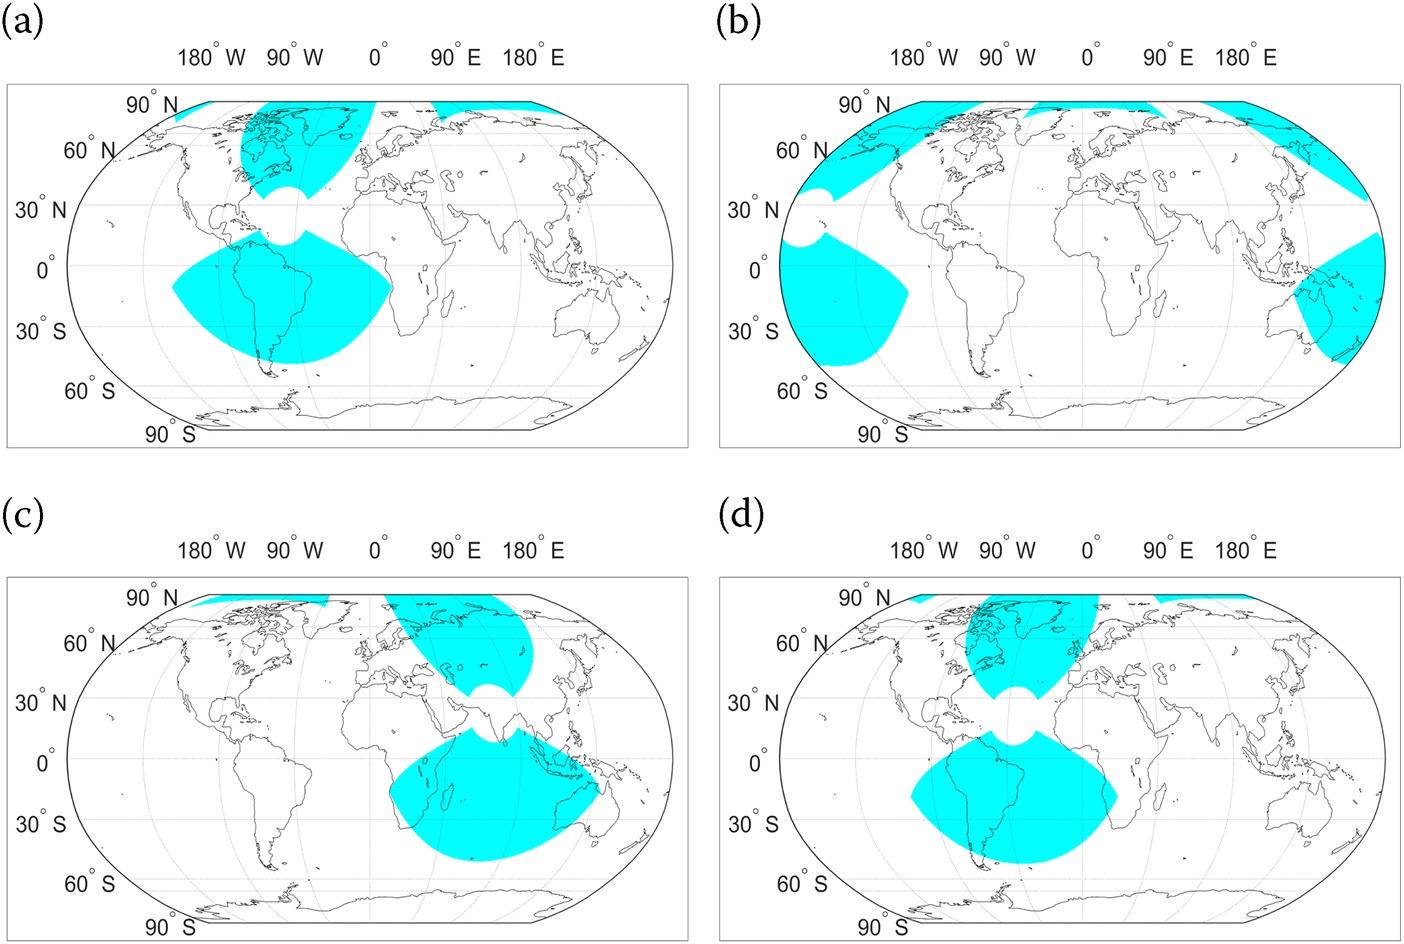
FIGURE 10.10 The Moon-based SAR’s spatial coverage at (a) 00:00:00, (b) 08:00:00, (c) 16:00:00, and (d) 24:00:00 on March 20, 2024.
For comparison, the hourly variations in the spatial coverage of the Moon-based SAR with a small size of the nadir point’s latitude are presented in Figure 10.11. The visit time is reset to 00:00:00 on March 25, 2024, when the latitude of the nadir point approaches to 0°. The spatial coverage of the Moon-based SAR within one day is still significant when the size of the nadir point’s latitude is small, but neither the North Pole nor the South Pole of the Earth can be observed. Also, the revisit time of the observed region is less than one day as a result of the extensive spatial coverage and Earth’s self-rotation. Moreover, the effects of the lunar revolution result in the eastward motion of the spatial coverage after a one-day lapse, as well. Furthermore, a blind region of considerable extent appears on the region bounded by the far grazing angle, implying the effects of the near grazing angle and the bound of the azimuthal angle are indeed not negligible even when the size of the nadir point’s latitude is small.
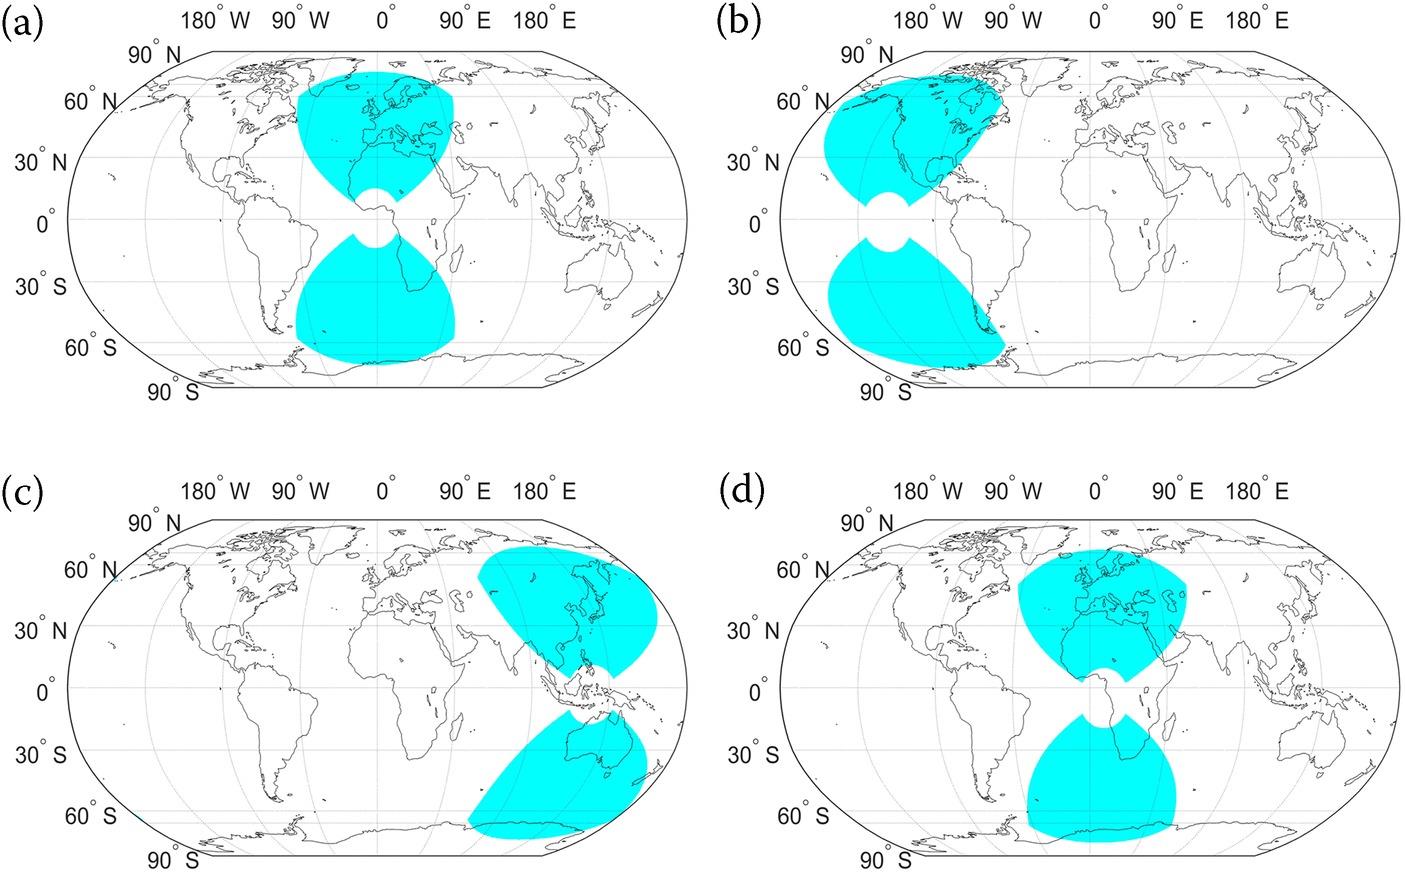
FIGURE 10.11 The Moon-based SAR’s spatial coverage at (a) 00:00:00, (b) 08:00:00, (c) 16:00:00, and (d) 24:00:00 on March 25, 2024.
10.2.5.2 Global Accumulated Visible Time within Different Periods
To exploit the spatiotemporal variation in the Moon-based SAR’s ground coverage for a specified period, we analyze the accumulated visible time that is the accumulated time for a specific area covered by the Moon-based SAR within a specified period. The global daily-accumulated visible time of the Moon-based SAR on March 20, March 25, April 01, and April 07 of 2024 are shown in Figures 10.12(a–d), respectively. As is seen, the majority of the world can be covered by the Moon-based SAR within one day, and those regions are observed continuously, ranging from several hours to tens of hours. Besides, there is a conspicuous stripe that lies along the track of the nadir point, indicating that the daily-accumulated visible time is affected by the near grazing angle. Also, the longitudinal accumulated visible time approximates to uniformly distribute. By contrast, the distribution of the latitudinal accumulated visible time depends on the nadir point’s latitude. When the nadir point’s latitude is in the northern hemisphere of the Earth, the maximum latitudinal accumulated visible time appears at the region near the North Pole whereas the fully Antarctica cannot be observed. The trend reverses when the nadir point lies in the southern hemisphere of the Earth. Once the nadir point’s latitude approaches 0°, the latitudinal accumulated visible time trends to be symmetrically distributed. In such a situation, neither of the Earth’s poles could be observed by the Moon-based SAR within one day.
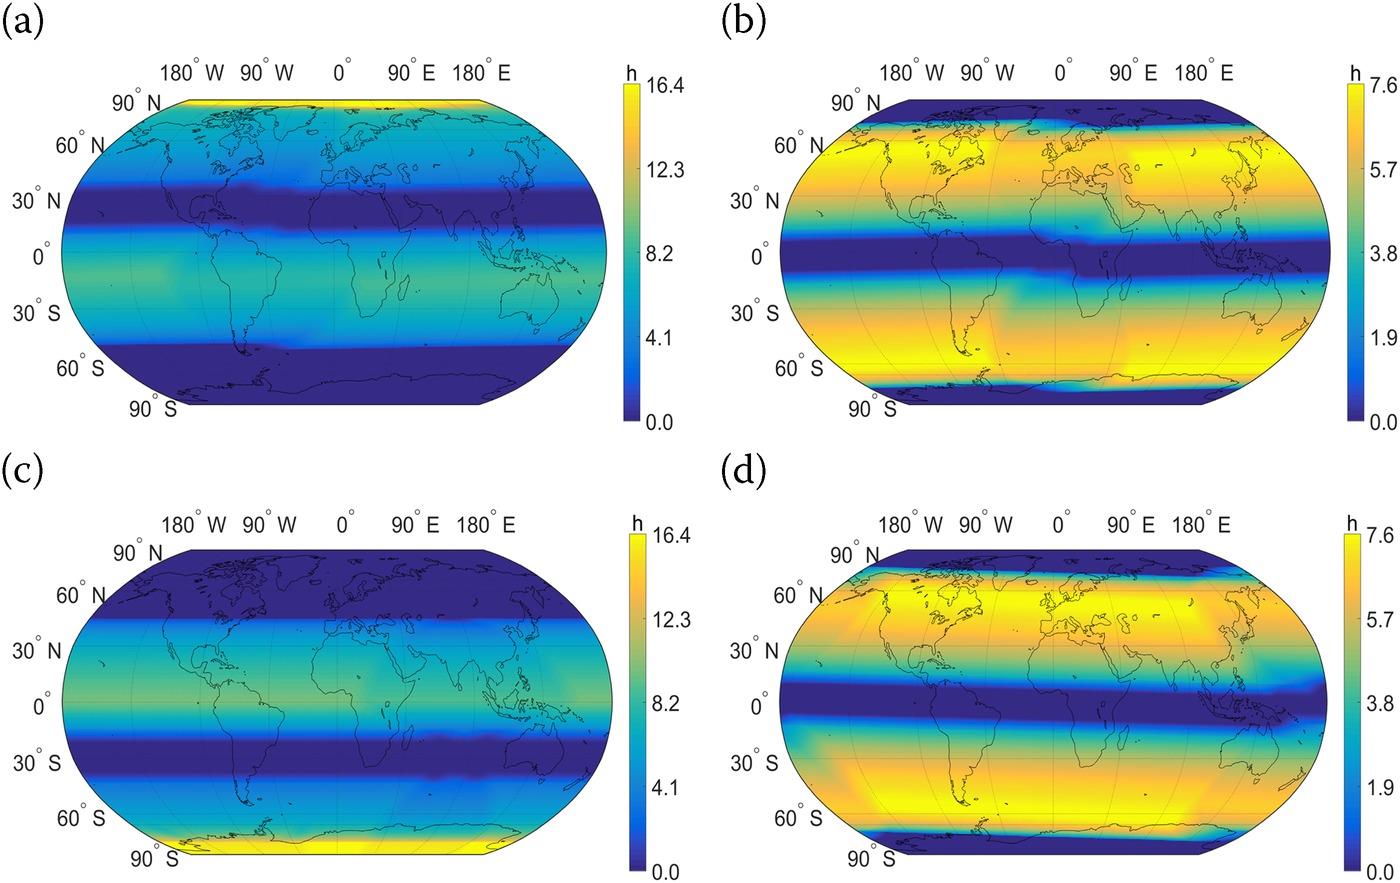
FIGURE 10.12 The global daily accumulated visible times of the Moon-based SAR on (a) March 20, (b) March 25, (c) April 01, and (d) April 07, 2024.
In general, there is not distinct regularity in the lunar revolution for one Julian year (365.25 days). Thus, the accumulated visible time over one Julian year cannot certainly reflect the tendency of the spatiotemporal coverage of the Moon-based SAR. As a result, the accumulated visible time of the Moon-based SAR within one Julian year is not presented. However, the inclination angle of the lunar orbit with respect to the Earth’s equator periodically varies with a period of 18.6 years [18,22]. Hence, the range of the latitude of the nadir point reaches a maximum or minimum every 18.6 years. Hence, it is of interest to illustrate the accumulated visible time of the Moon-based SAR over 18.6 years. By setting the initial visit time to 00:00:00 on March 20, 2024, the global accumulated visible time of the Moon-based SAR over 18.6 years is presented in Figure 10.13. The global accumulated visible time of the Moon-based SAR over 18.6 years is on the order of several years. Also, the longitudinal accumulated visible time trends uniformly distributed. In comparison, the latitudinal accumulated visible time is symmetrically distributed about the Earth’s equator. What is more, the peak values of the latitudinal accumulated visible time appear at ±40° of latitudes, whereas the valleys occur at high latitudes with a size around 80°. Interestingly, there are apparent stripes above and below the Earth’s equator in global accumulated visible time within an 18.6-year period, which is given rise by the effect of the near grazing angle. This implies the near grazing angle exerts a considerable impact on the spatiotemporal coverage of the Moon-based SAR with a period of 18.6 years.
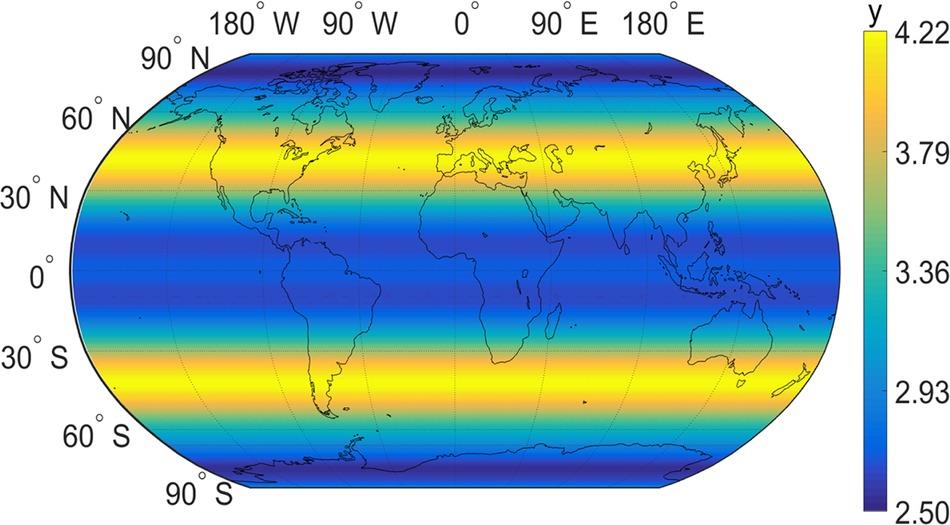
FIGURE 10.13 The global accumulated visible time of the Moon-based SAR over a period of 18.6 years. The symbol ‘y’ represents the Julian year.
Typically, the accumulated visible time over a period of one nodical month or one Julian year is different from that over the next period due to the temporal variation in the lunar orbital inclination. Thus, the accumulated visible time within one nodical month or one Julian year is not suitable for setting a Moon-based SAR. In contrast, the lunar orbital inclination is periodically varying every 18.6 years, thus the accumulated visible time of the Moon-based SAR within a period of 18.6 years is approximately the same as that in the next period of 18.6 years.
For the effective range-limited grazing and azimuthal angles, the far grazing angle plays a dominant role in determining the spatiotemporal coverage of the Moon-based SAR. The effects of the near grazing angle and bound of azimuthal angle are also profoundly significant to affect the spatiotemporal coverage. Regarding the optimal site selection, the site near the lunar North Pole is preferred for observing the Arctic of the Earth, while the site near the lunar South Pole may be a good choice for observing Antarctica. For other regions on the Earth, the site of the Moon-based SAR has no bearing on the spatiotemporal coverage of the Moon-based SAR over a long period. Consequently, the Moon-based SAR can perform long-term, continuous Earth observations on a global scale to enhance our capabilities of understanding the planet.
10.3 PROPAGATION THROUGH IONOSPHERIC LAYERS
By considering the application requirements and system performance of the Moon-based SAR, L-band is chosen as one of the main carrier frequencies of Moon-based SAR [9]. The L-band propagation effect through troposphere is relatively small, though not negligible, compared to ionospheric effect [23]. The lunar ionospheric electron content is two orders of magnitude less than that of the Earth’s ionosphere with a far thinner thickness, thus its impact may be ignored [24]. Hence, the ionospheric layer of the Earth is the primary factor that affects the imaging geometric and radiometric qualities of the Moon-based SAR.
Ionosphere exerts profound but measurable effects on the SAR imaging by at least three accounts. First, the Faraday rotation (FR) effect rotates the energy from co-channels to cross-channels, subsequently leading to attenuation of the SAR signal [25]. Second, the phase dispersion of the background ionosphere causes a phase advance in signal, resulting in target image shift, resolution deterioration and image defocusing [26]. Third, it should be mentioned that the ionospheric scintillation gives rise to fluctuations in the amplitude and phase of the SAR signal, further impair the SAR focusing [27]. Besides, as long as estimating the ionospheric effects on SAR imaging is concerned, the ionospheric inhomogeneous nature is a considerable factor [28].
10.3.1 PHASE ERROR DUE TO TEMPORAL-SPATIAL VARYING BACKGROUND IONOSPHERE
The synthetic aperture of the Moon-based SAR is realized mainly by the Earth’s rotation. The long slant range history and relative slow Earth’s rotating velocity bring about an extremely long synthetic aperture time, further resulting in the temporal-variation characteristics of the background ionosphere. For a rigorous study, the relationship between the synthetic aperture time and the azimuthal resolution of the Moon-based SAR is now examined.
The synthetic aperture time, the aperture length in azimuth, can be accurately obtained by
where and are defined as the start time and end time when a point target is illuminated of one full aperture in azimuth, respectively. Both of them can be calculated by:
where is the slant range vector of the Moon-based SAR at time , is the slant range vector at time , is the slant range vector at the beam center crossing time ; is the half-power beam width in radians defined as
where is the wavelength, is the aperture length in azimuth.
The azimuthal resolution of the Moon-based SAR is determined by
where is the Earth’s radius, and is the distance between the Earth and Moon-based SAR (see Figure 10.1); is the latitude of the Earth’s target, is the declination of the Moon-based SAR. is the angular difference between the Moon-based SAR’s ascension and the longitude of the Earth’s target at beam center crossing time. As can be seen, three extra terms: , and are presented to modify the ideal azimuth resolution [12].
By combining Equations 10.48–10.50, the relationship between the synthetic aperture time and azimuthal resolution is plotted in Figure 10.14, with, as an example, the declination of the Moon-based SAR set to be 28.5° and latitude of the Earth’s target assumed to be 0°.
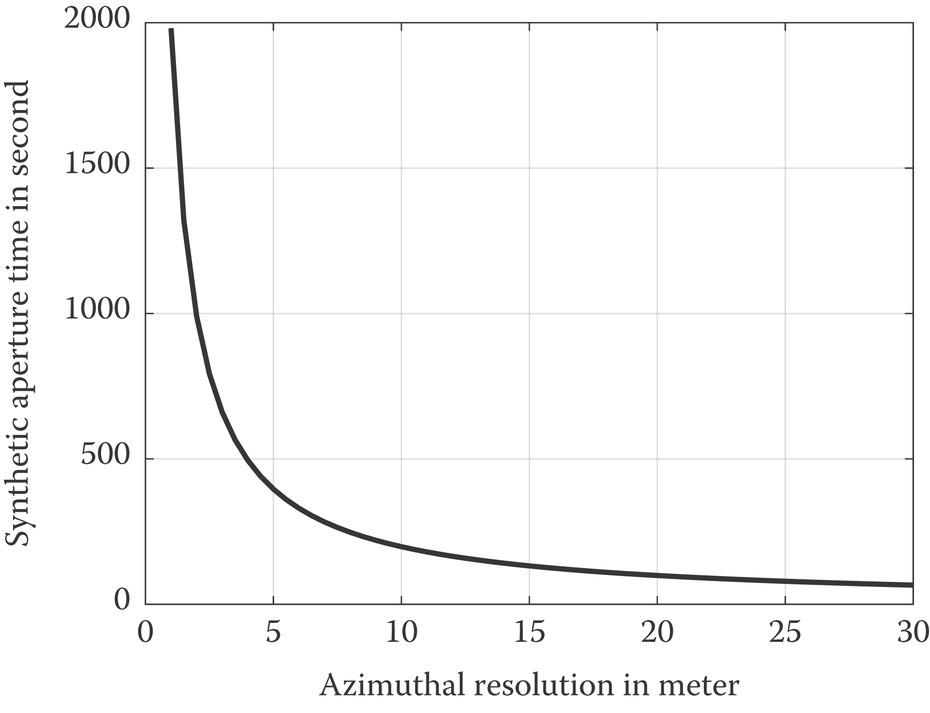
FIGURE 10.14 The relationship between the synthetic aperture time and azimuthal resolution, here the angular difference between the ascension of Moon-based SAR and the longitude of the Earth’s target is assumed to be 0°.
As can be seen from Figure 10.14, the synthetic aperture time of the Moon-based SAR can be up to hundreds or even thousands of seconds. In contrast, the synthetic aperture time of the LEOSAR is usually limited to 1–2 s. As a result, it seems that the ionospheric freezing assumption for LEOSAR loses its effect in the Moon-based SAR. To catch a better notion, in Figure 10.15, we plot the measured vertical TEC at Guangzhou, China (113.23°E, 23.16°N), with a synthetic aperture time of 1800 s, a typical value of the Moon-based SAR. The TEC data used in the schematic diagram for the temporal variation of background ionosphere is acquired in October 2016 and reported by International Reference Ionosphere 2012 (IRI 2012) [29].
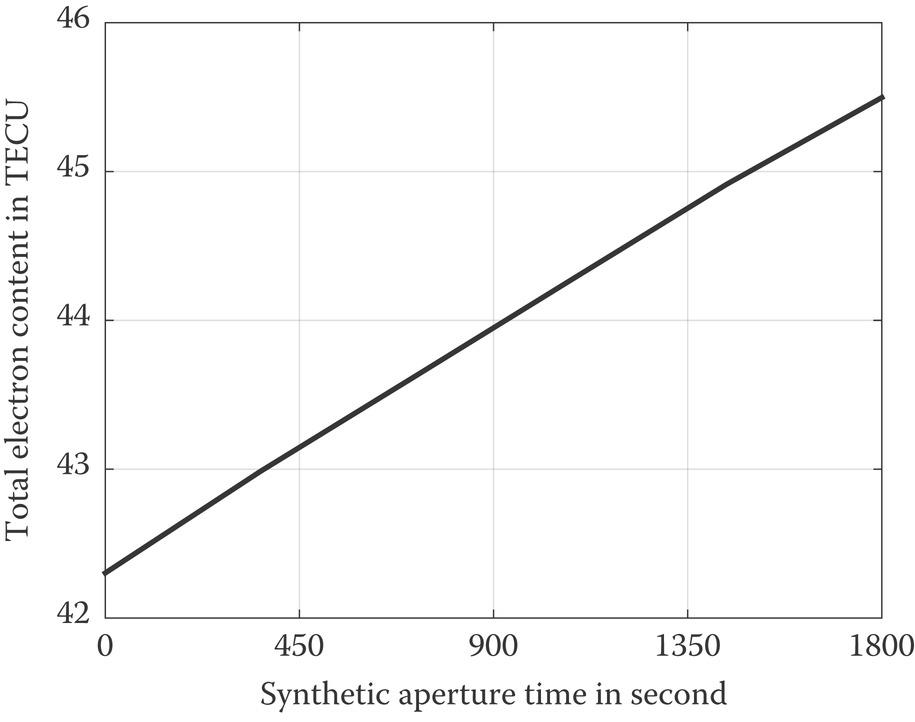
FIGURE 10.15 The measured temporal-varying ionospheric vertical TEC at 12:00–12:30 local time.
It is clear that the variation of the vertical TEC over a period during the synthetic aperture time exceeds 3 TECU, which seems quite appreciable, and the TEC temporal variation is nonlinear. Consequently, the temporal-varying background ionosphere should be taken into consideration, thus the temporal-varying ionospheric TEC is supposed to express in the form of slow time:
where is the constant component of TEC with respect to slow time, which remains constant with the varying time for a given position; , is the derivative of the temporal-varying TEC against the slow time .
Because the Moon-based SAR is observing the Earth on a global scale, the spatial-varying ionospheric TEC at different positions within the imaging swath should be taken account, as is evident from the strongly varying TEC with relative positions of the ground target illustrated in Figure 10.16.
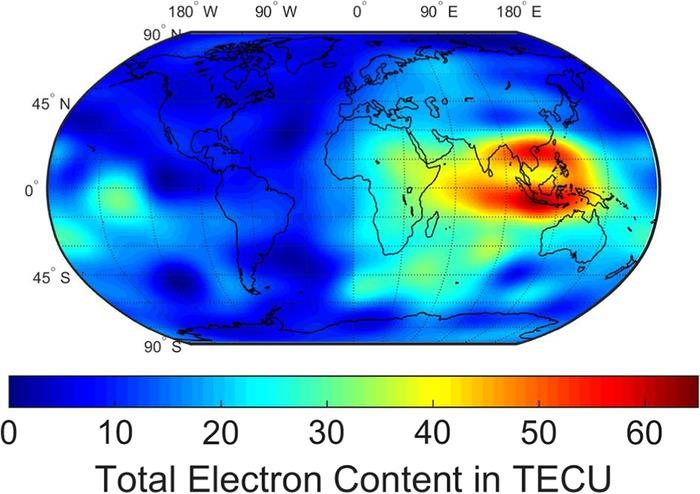
FIGURE 10.16 The global distribution of the vertical TEC in TECU at 08:00 UTM, 22 October 2016. Data was taken from [30].
Assume that the spatial variation of the TEC along the azimuth direction is time-invariant, the spatial-varying TEC can be written as:
where is the constant component of TEC regarding the azimuth distance at specified time; , are the change rates of spatial-varying TEC over azimuth distance at various orders; note that is the relative motion distance between the Moon-based SAR and the ground target taking account of spatial-varying background ionosphere along azimuth direction within an epoch of , which is defined as:
where is the relative velocity of the ionospheric TEC above the rotating Earth, given by
where is the Earth’s radius, is the ionospheric equivalent height, is the ground target’s latitude, is the Earth’s rotation velocity, is the scale factor given rise by lunar revolution as to be detailed below.
It is known that the temporal and spatial variations of the background ionosphere are highly-coupling in practice. Thus, the temporal-spatial varying ionospheric TEC can be readily expressed in terms of slow time :
where is the constant component of temporal-spatial varying ionospheric TEC; is derivative of the temporal-spatial varying TEC with respect to slow time defined as: .
When the SAR signal propagates through the ionosphere, the phase-path length will be changed under the impact of the background ionosphere [31]. The phase error induced by the change of the phase-path length in the round-trip can be defined as
where , is the propagation velocity of the electromagnetic wave in free space, is the range frequency and is the carrier frequency.
It turns out that the phase error induced by the temporal-spatial varying background ionosphere should be modified by substituting Equation 10.57 into Equation 10.58:
It shows in Equation 10.59 that the spatial-varying ionospheric TEC, together with the temporal-varying ionospheric TEC, further makes the background ionospheric effects even more complicated. It may be drawn that the spatial-variation of background ionosphere within an image scene is approximately time-invariant, implying that the ionospheric TEC in Equation 10.57 potentially can be used to probe the temporal-spatial background ionospheric effects [32].
10.3.2 SLANT RANGE IN THE CONTEXT OF BACKGROUND IONOSPHERIC EFFECTS
To derive an expression of the slant range, a right-handed geocentric inertial reference frame is defined, with Z-axis towards the North Pole, and X-axis pointing to the true equinox of the date (referring to Figure 10.1). Without loss of generality, let’s initialize the azimuth time to zero for the shortest distance between the ground target and the Moon-based SAR. The slant range between the Moon-based SAR and the ground target at the time takes the following expression:
where is the angle that the ground target rotates from the zero azimuth time position to the position at , is the angular velocity of the Earth’s self-rotation, is the longitude of ground target at zero azimuth time; are coordinates of the Moon-based SAR in considering of the lunar revolution with:
In above equations, is the angular velocity of the lunar revolution; is the inclination of the lunar orbit to of the Earth’s equator.
Recalled that the propagation distance of the Moon-based SAR is over hundreds of times longer than that of the LEOSAR, thus the “stop-and-go” assumption used in the LEOSAR is no longer applicable for the Moon-based SAR [16]. Now let’s calibrate the error in “stop-and-go” assumption: Suppose that the transmitted signal arrives to the ground target at time T1, where . In an epoch of propagation delay TD, the Moon-based SAR has moved forward for a certain distance to the new position, so now the slant range between the ground target and radar is . The backscattering signal is received at a time . The total time delay of wave propagation is the sum of T1 and T2:
where TD is typically between 2.3s and 2.7s [16]. Notice that the time delay given rise by the atmosphere is far smaller than TD; therefore, it can be reasonably ignored in removing the “stop-and-go” assumption. The Moon-based SAR observation geometry under “non-stop-and-go” assumption shown in Figure 10.17 depicts a scenario whereas the transmitted signal scatters back, the radar moves a distance within an epoch of TD. Thus, the Moon-based SAR can no longer be regarded as operating in monostatic, but instead in bistatic mode.
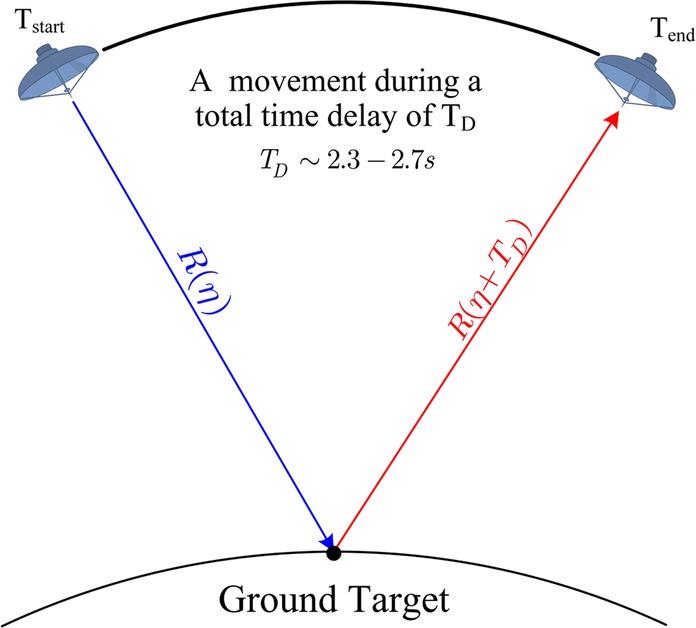
FIGURE 10.17 The equivalent observation geometry of the Moon-based SAR with “non-stop-and-go” assumption. During TD the Moon-based SAR has moved for an equivalent distance where the ground target is regarded as stationary while the Moon-based SAR rotates (Sketch not to scale).
Finally, the slant range for the Moon-based SAR under the equivalent bistatic mode could be written as:
It is seen that the 4th order Taylor series range equation is capable of dealing with the curved trajectory of the Moon-based SAR’s signal during the long synthetic aperture time, which is most suitable for Moon-based SAR imaging [16]. Consequently, the slant range can be expanded into Taylor series up about to 4th order,
where R0 is the shortest slant range. The derivation of expansion coefficients is straightforward but tedious. Complete expressions for Ri are given in [16].
10.3.3 SAR SIGNAL IN THE CONTEXT OF BACKGROUND IONOSPHERIC EFFECTS
We shall establish a Moon-based SAR signal model in considering of background ionospheric effects, based on the curved trajectory, in which the relative positions between the Earth target and the Moon-based SAR are accounted for. The received signal of the Moon-based SAR system from the point of interest can be written as [33]
where and are window functions in fast time and slow time domains, respectively; is the chirp rate.
Fourier transform in range direction is first applied to Equation 10.67 by using the principle of stationary phase (POSP):
Consequently, the signal under the effects of the temporal-varying background ionosphere can be obtained by including the phase shift Equation 10.59 into the signal Equation 10.68:
Taking Fourier transform along azimuth direction in Equation 10.69 by virtue of the POSP and the method of series reversion (MSR) [33], we have
where the phase takes the form
where , .
From Equation 10.71, we see that the range and azimuth frequency are highly coupled in the phase term. To process the signal and to identify the background ionospheric effects on the Moon-based SAR imaging, Equation 10.71 is further expanded as follows:
where is related to range compression through
is in connection with the azimuth compression and is expressed as
is the range cell migration term which takes the form of
where accounts for secondary range compression, explicitly given by
and is the residual phase term given by
At this point, we have established the signal model and 2-D spectrum, based on the curved trajectory, taking accounts of he temporal-spatial varying background ionospheric effects. It can be seen from Equation 10.73 through Equation 10.77 that all the terms are closely related to TEC. Besides, the imaging performance in the range direction is impacted by the range compression term . The residual phase term does not affect the Moon-based SAR imaging. As for the azimuthal imaging, it is impacted by the azimuth compression term , the range cell migration term and the secondary range compression term under the effects of background ionosphere.
Numerical results [32] show that the absolute phase errors of the range cell migration term, and second range compression term are negligibly small in comparison with the azimuth compression term. Consequently, the azimuth compression term dominates the focusing of the Moon-based SAR. Also, the range cell migration term, and secondary range compression term, unlike the azimuth compression term, exercise little effects on azimuthal imaging.
10.4 IMAGE DISTORTIONS BY DISPERSIVE EFFECTS
The background ionospheric effects on the Moon-based SAR imaging are examined from the phase terms given in Equations 10.73 and 10.74. The background ionospheric effects can be split into the range and azimuth aspects, and are illustrated by using the simulation parameters given in Table 10.3. For the sake of brevity but without loss of generality, the angular difference between the ground target’s longitude and Moon-based SAR’s ascension at beam center crossing time is assumed 0° in the following analysis.
TABLE 10.3
Simulation Parameters for the Moon-Based SAR System
| Symbol | Parameters | Quantity | Unit |
| Latitude of the ground target | 22.5 | degree | |
| Declination of the Moon-based SAR | 28.5 | degree | |
| Inclination of the lunar orbit to the equator of the Earth | 28.6 | degree | |
| Earth radius | 6,371 | km | |
| The distance between the Earth and Moon-based SAR | 389,408 | km | |
| Earth’s rotation angular velocity | 7.292 × 10⁻⁶ | rad/s | |
| Lunar revolution angular velocity | 2.662 × 10⁻⁶ | rad/s | |
| Carrier frequency | 1.2 | GHz | |
| System bandwidth | 50 | MHz | |
| Ionospheric equivalent height | 400 | km |
10.4.1 IONOSPHERIC EFFECTS ON RANGE IMAGING
Through the range compression term given in Equation 10.73, the background ionospheric impacts on range imaging by manifesting the range shift and defocusing. It is recognized that the range shift is caused by the linear term due to group delay, while the range defocusing is induced by the quadratic term and cubical term. Besides, the range resolution is deteriorated due to broaden chirped pulse, which is silently imbedded in the quadratic term. Moreover, a ghost image may appear in the range direction as a result of asymmetric distortion of the signal caused by the cubical term [34]. In what follows, the detailed effects of phase shift on the range imaging are analyzed by Equation 10.73.
10.4.1.1 Range shift
According to the linear term in Equation 10.73, the range shift can be expressed as:
As can be seen from Equation 10.78, the range shift consists of two terms: one is the image shift caused by the constant component of ionospheric TEC under the ionospheric freezing assumption, and the other one is the range shift caused by the temporal and spatial gradients of ionospheric TEC related to the temporal-spatial varying part of background ionosphere. The second term of the range shift can be further divided into two parts based on the different contribution parts from temporal-spatial varying background ionosphere: induced by the temporal-varying part of the background ionosphere and caused by the spatial-varying part of the background ionosphere. Since we can get each of them by letting another part of the ionospheric TEC gradient be zero, thus they are not expressed separately.
The range shift caused by the constant component of background ionosphere, , is proportional to the constant component of the TEC and is inversely proportional to squared of the carrier frequency. The range shift , induced by the temporal-spatial varying part of background ionosphere, has an obvious dependency on the temporal and spatial gradients of ionospheric TEC and the carrier frequency. Also, the range shift is dependent on the relative position between the ground target and the Moon-based SAR as well.
Figure 10.18(a) and (b) show the temporal-varying background ionosphere contribution part of the range shift, with different Moon-based SAR’s declinations with the Earth’s latitude under normal ionosphere and during an ionospheric storm. Similarly, the spatial-varying ionospheric TEC contribution part of range shift, , under normal ionosphere and ionospheric storm are plotted in Figure 10.18(c) and (d), respectively. The overall range shift induced by the temporal-spatial varying part of the background ionosphere, , are plotted in Figure 10.18(e) and (f), eventually.
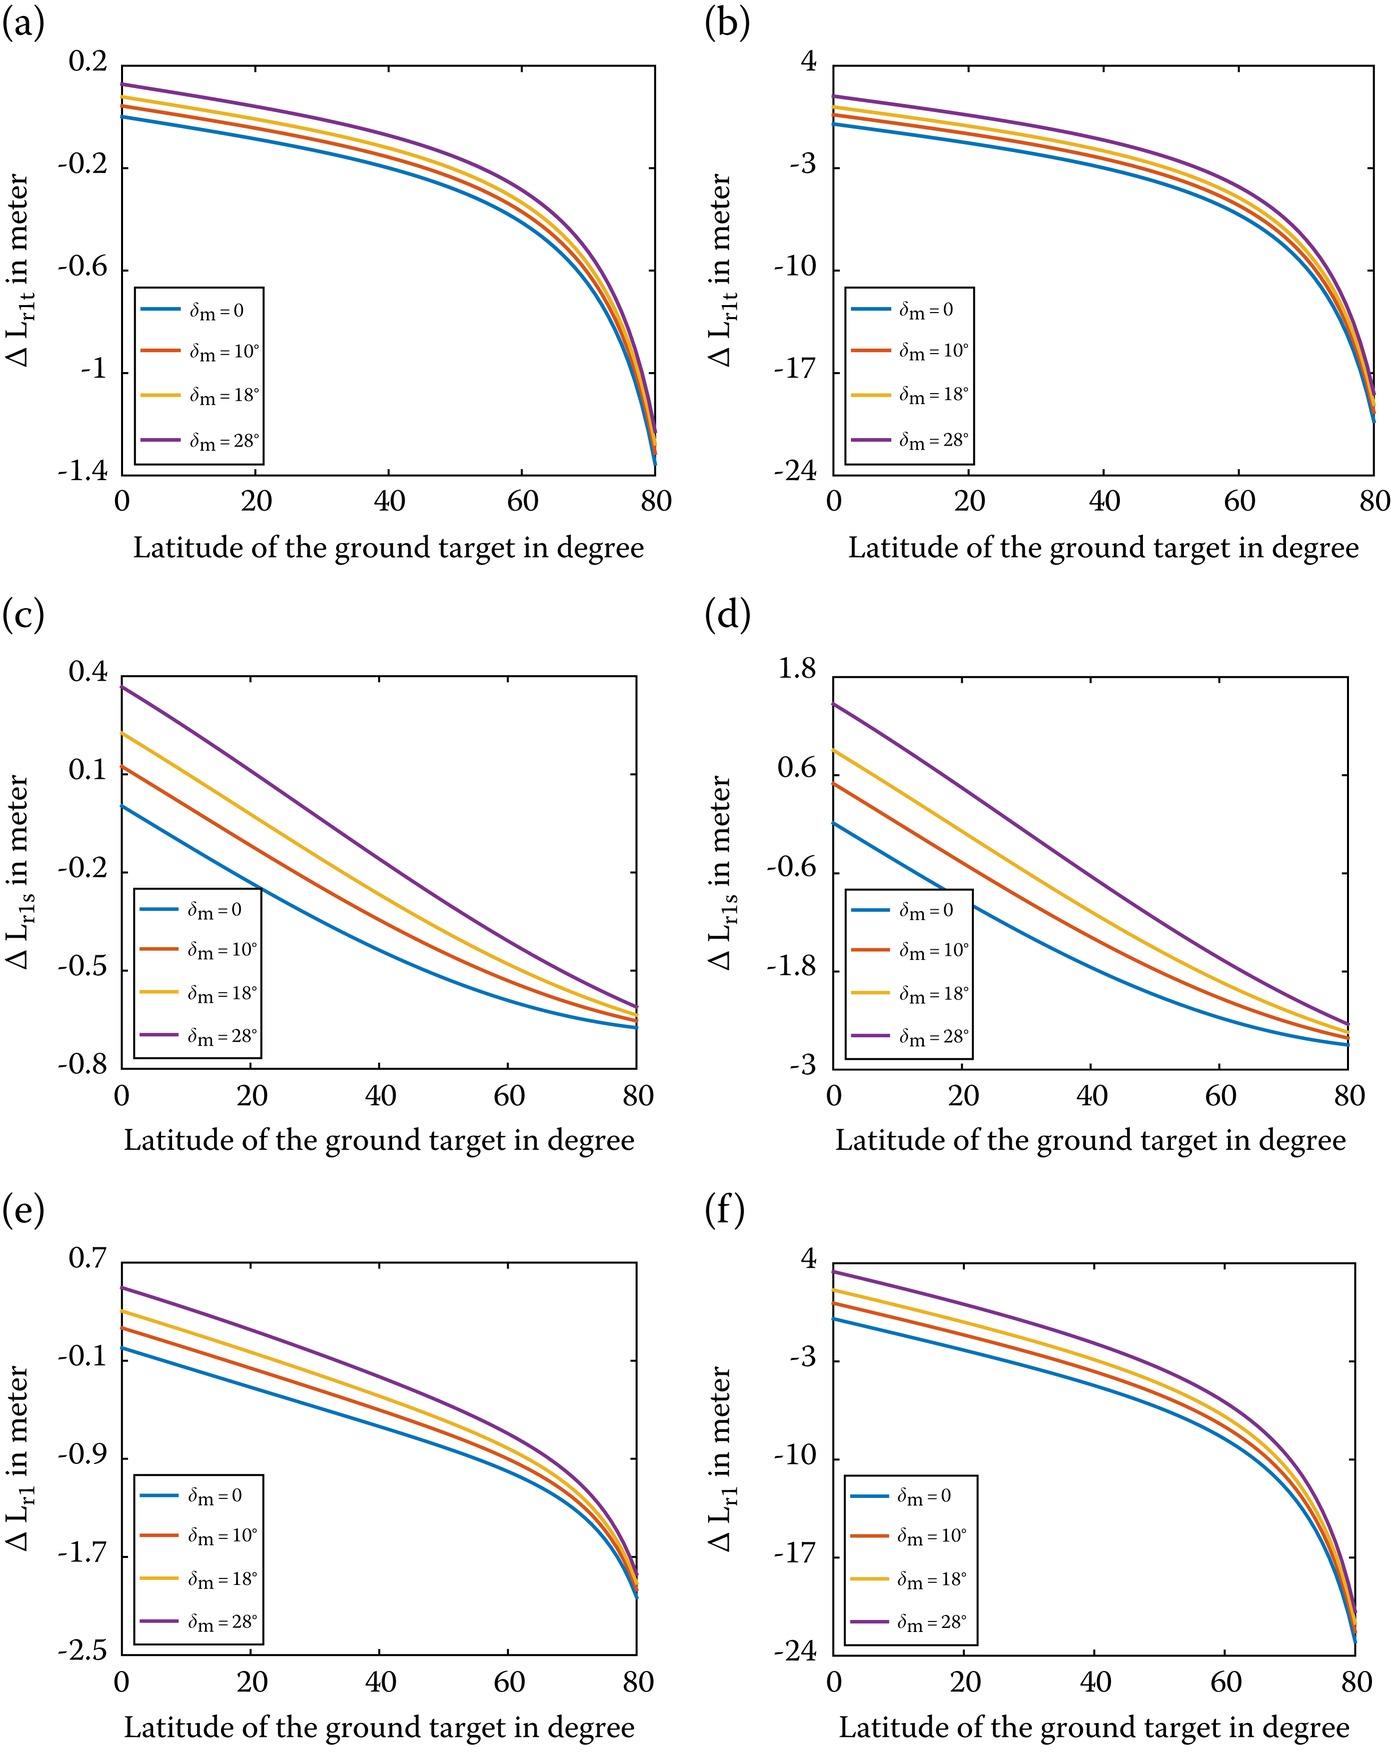
FIGURE 10.18 The range shift caused by temporal-varying background ionosphere under (a) normal ionosphere, (b) ionospheric storm; The range shift caused by spatial-varying background ionosphere under (c) normal ionosphere, (d) ionospheric storm; The range shift caused by temporal-spatial varying background ionosphere under (e) normal ionosphere, (f) ionospheric storm.
From Figure 10.18(a)–(d), we see that both the temporal-varying and spatial-varying background ionospheres bring about range shifts, which are in negative connection with the ground target’s latitudes but positively correlated with the Moon-based SAR’s declination. Yet their variations with respect to the Earth’s latitudes and Moon-based SAR’s declinations are different because the range shift caused by the temporal-varying part of the background ionosphere is only related to the change rate of slant range, while , induced by the spatial-varying part of the background ionosphere, is dependent on both change rate of slant range and ionospheric TEC relative motion velocity that is related to the relative position of the ground target’s latitude and Moon-based SAR’s declination. Besides, the range shift is the contribution from the TEC temporal gradient and spatial gradient; either variation of them leads to different .
Next, we plot the 1-D range profile of point target response at the of the Earth’s latitude of 22.5° under the effect of the range shift for the cases of normal ionosphere and ionospheric storms in Figure 10.19(a) and (b). Then the 1-D range profile of point target response with the same TEC status as Figure 10.19(a) and (b) at the latitude of 62.5° are drawn in Figure 10.19(c) and (d), respectively.
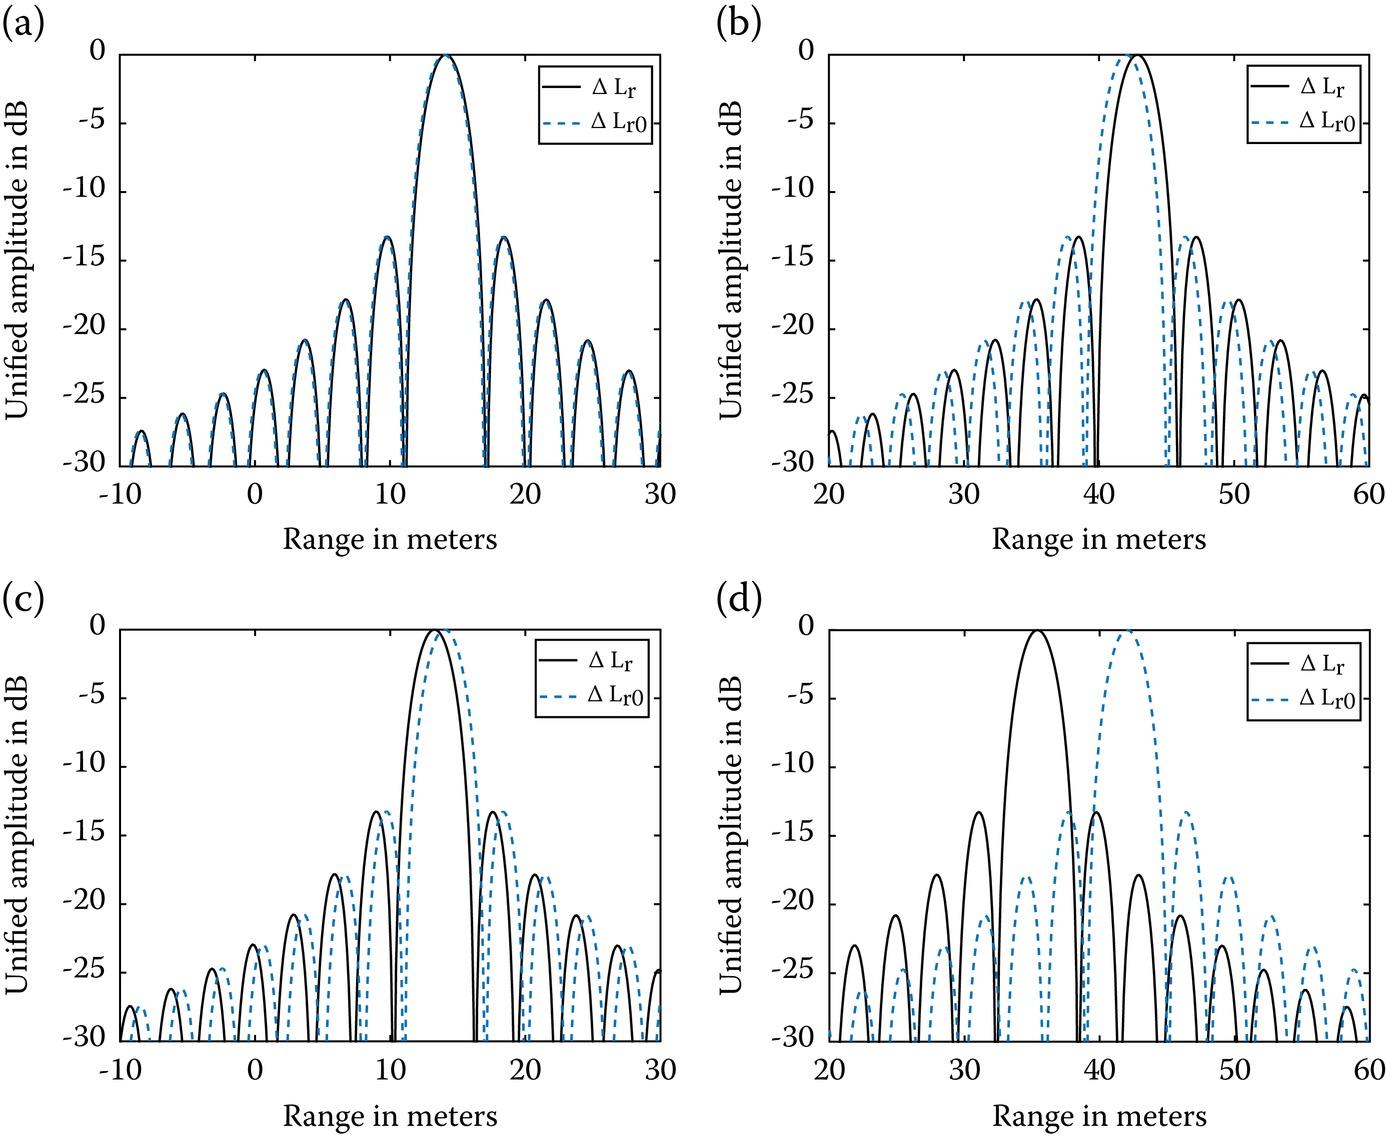
FIGURE 10.19 The 1-D range profile of point target response at the latitude of 22.5° under the effect of range shift under: (a) normal ionosphere ΔLr = 14.12 m, ΔLr0 = 14.00 m; (b) ionospheric storm ΔLr = 42.83 m, ΔLr0 = 42.00 m. The 1-D range profile of point target response at the latitude of 62.5° under the effect of range shift with: (c) normal ionosphere ΔLr = 13.24 m, ΔLr0 = 14.00 m; (d) ionospheric storm ΔLr = 35.36 m, ΔLr0 = 42.00 m.
As illustrated from Figure 10.19, the range shift caused by the temporal-spatial varying background ionosphere is on the order of tens of meters under normal ionosphere while it can be up to dozens of meters during an ionospheric storm. Moreover, the range shift caused by the constant component of ionospheric TEC under the ionospheric freezing assumption plays a dominating role in determining the whole range shift. The range shift induced by the temporal-spatial varying background ionosphere is relatively small but not negligible under normal ionosphere while it is potential enough during an ionospheric storm.
If we project the slant range shift onto ground range, then the ground range shift is:
where the incident angle is given by
The incident angle in the above equation is related to the latitude of the ground target and declination of the Moon-based SAR, and is spatial-varying as well. As a result, the spatial-varying incident angle, together with the temporal-spatial varying range shift, brings about the temporal-spatial variation of the ground range shift, further complicating the geometric distortion.
Figure 10.20(a) displays the ground range shift under the normal ionosphere as a function of the ground target’s latitude with different declinations with the simulation parameters given in Table 10.4 taken from [32]. The ground range shift under the ionospheric storm is drawn in Figure 10.20(b) by using the same simulation parameters as Figure 10.20(a).
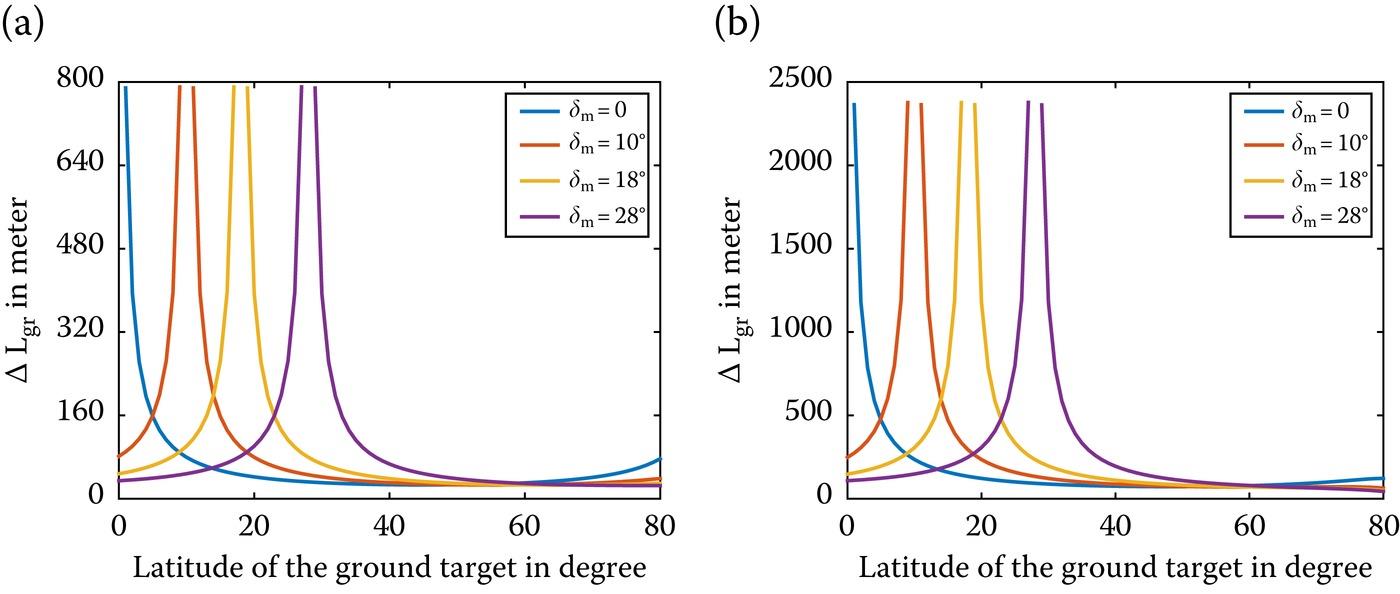
FIGURE 10.20 The ground range shift caused by temporal-spatial varying background ionosphere as a function of the ground target’s latitude with different Moon-based SAR’s declinations under (a) normal ionosphere, (b) ionospheric storm. Note that the point of is the nadir point.
TABLE 10.4
Temporal and Spatial Gradient of Temporal-Spatial Varying TEC [32]
| Temporal Derivative | Quantity | Unit | Spatial Derivative | Quantity | Unit |
| s1 | 5.28 × 10‒3 | TECU/s | k1 | ‒6.55 × 10‒5 | TECU/m |
| s2 | ‒3.56 × 10‒7 | TECU/s2 | k2 | 7.49 × 10⁻¹⁴ | TECU/m2 |
| s3 | ‒7.81 × 10⁻¹¹ | TECU/s3 | k3 | ‒2.43 × 10⁻²⁰ | TECU/m3 |
| s4 | ‒5.24 × 10⁻¹⁵ | TECU/s4 | k4 | 2.59 × 10⁻²⁶ | TECU/m4 |
It can be observed in Figure 10.20 that the ground range shift is on the order of dozens of meters under normal ionosphere while the maximum value of the ground range shift can be up to thousands of meters during an ionospheric storm. When the latitude of the ground target is within 60°, the ground range shift depends on the difference between the ground target’s latitude and Moon-based SAR’s declination. However, if the ground target’s latitude is larger than 60°, the ground range shift becomes a positive correlation from a negative correlation with the difference between the ground target’s latitude and Moon-based SAR’s declination. The cause of this phenomenon is attributed to that the range shift caused by the temporal-varying background ionosphere begins to show an obvious impact on the whole ground range shift.
The 1-D range profile in the presence of the ground range shift at different ground target’s latitude and Moon-based SAR’s declinations are simulated and plots in Figure 10.21. The simulation parameters are given in Table 10.3 except for the latitudes of ground target and declination of Moon-based SAR.
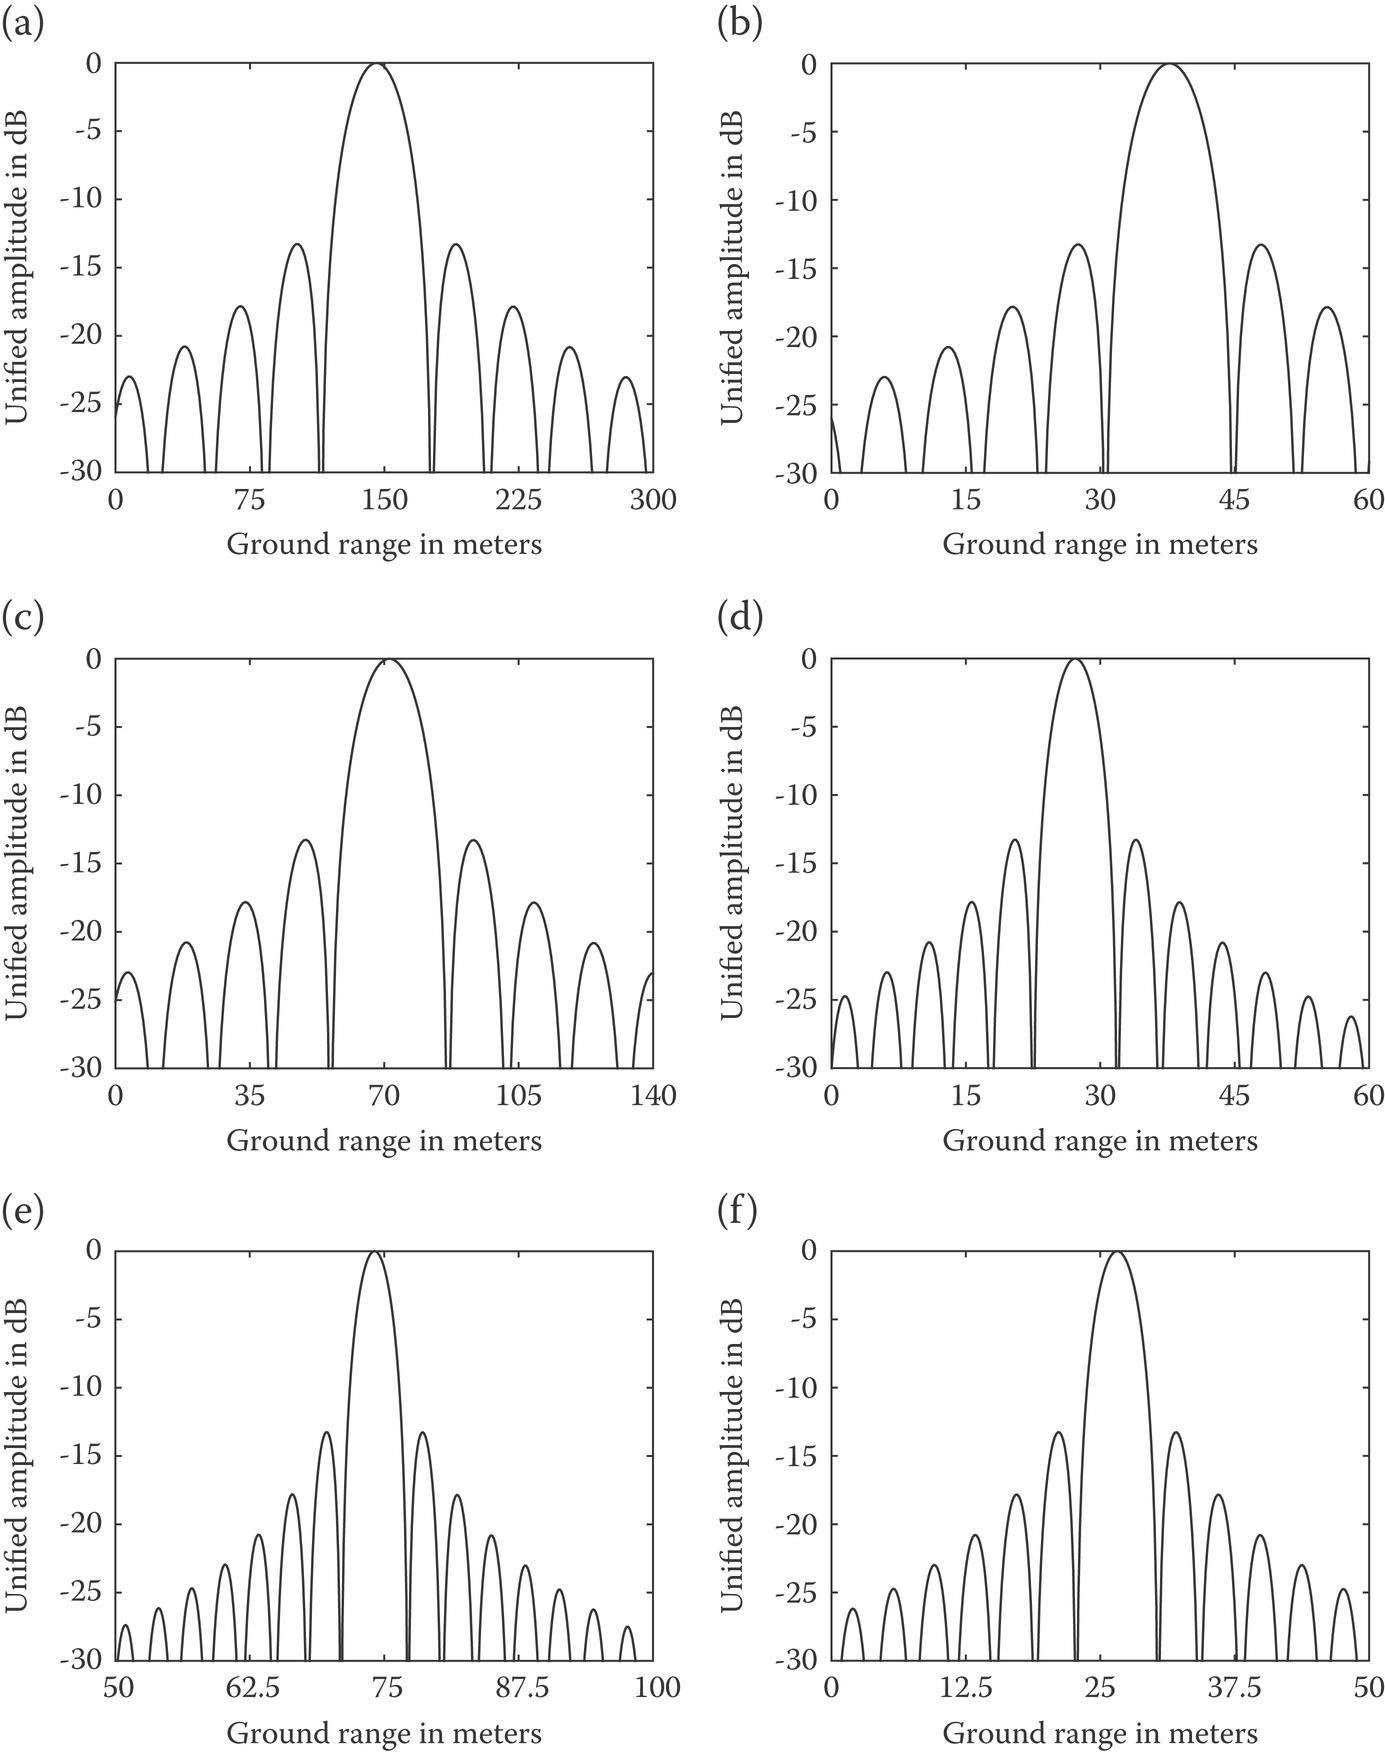
FIGURE 10.21 The 1-D range profile of point target response under the effect of range shift with: (a) , , ΔLgr = 145.48 m; (b) , , ΔLgr = 37.71 m; (c) , , ΔLgr = 71.24 m; (d) , , ΔLgr = 27.20 m; (e) , , ΔLgr = 74.06 m; (f) , , ΔLgr = 25.26 m. The ionospheric TEC status is set to TEC0 = 50 TECU, k1 = 0.2 TECU/min and s1 = 0.02 TECU/km.
From Figure 10.21, the ground range shift, ranging from dozens of meters up to hundreds of meters even under a normal ionospheric condition, can easily pose a threat to correctly pinpoint the ground target. As can be seen from Figure 10.21(a)–(d) that the ground range shift decreases with the increasing of the difference between ground target’s latitude and Moon-based SAR’s declination. Results, as displayed in Figure 10.21(e)–(f), show a contrary tendency with the ground target’s latitude of 79.6° in contrast with Figure 10.21(a)–(d).
10.4.1.2 Range Defocusing
Now examining the effects of the quadratic and cubical terms in Equation 10.73 is in order. As can be seen from Equation 10.73, both quadratic and cubical terms are merely correlated with the constant component of the TEC, indicating the range focusing is not disturbed by the temporal-spatial varying part of the background ionosphere.
According to Equation 10.73, the quadratic term inherently causes the filter mismatched, main lobe broaden, and side-lobes risen. These factors altogether contribute to deteriorate the range resolution. The cubical term may result in asymmetric distortion of the received signal, and further, bring about a ghost image in range direction.
A quadratic phase error (QPE) is defined in time domain to measure the pulse broadening [35]:
Equation 10.83 states that the QPE is proportional to the constant component of TEC and the squared of the system bandwidth for a specific carrier frequency. From SAR imaging theory, if QPE exceeds π/4, the filter mismatch and thus the range defocusing occur. The QPE as a function of TEC0 with different system bandwidths from 10 MHz to 200 MHz is plotted in Figure 10.22. It appears from Figure 10.22 that for the Moon-based SAR with a system bandwidth of 50 MHz, the range focusing is little affected by the QPE unless there is an ionospheric storm. But for a larger bandwidth, say 100 MHz, the range imaging severely degrades even if the TEC is just around 30 TECU.
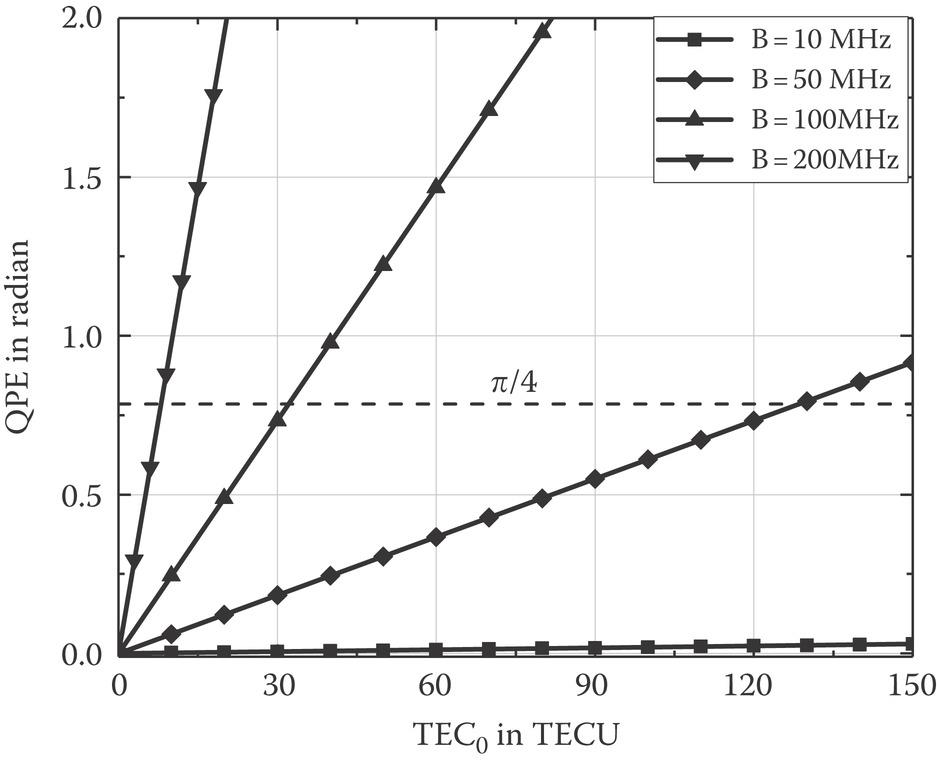
FIGURE 10.22 The quadratic phase error (QPE) as a function of TEC0 with different bandwidths.
In Figure 10.23, we plot the 1-D range profile of point target to see the effects of the QPE (no range shift). Range resolution, both idea and real, and measures of image quality in terms of peak to sidelobe ratio (PSLR) and integrated sidelobe ratio (ISLR) are listed in Table 10.5. We see that at 50 TECU the range resolution is slightly degraded for a bandwidth of 50 MHz and 100 MH; image quality in terms of PSLR and ISLR worsens for a larger bandwidth. For higher TEC at 150 TECU, range resolution at a bandwidth of 50 MHz is not affected much though PSLR and ISLR are higher– undesirable. At bandwidth of 100 MHz and 150 TECU, the range resolution is seriously degraded and PSLR and ISLR are unacceptable. In this regard, larger bandwidth makes it more difficult to maintain good image quality under the ionospheric exposure, especially in the case of ionospheric storm.
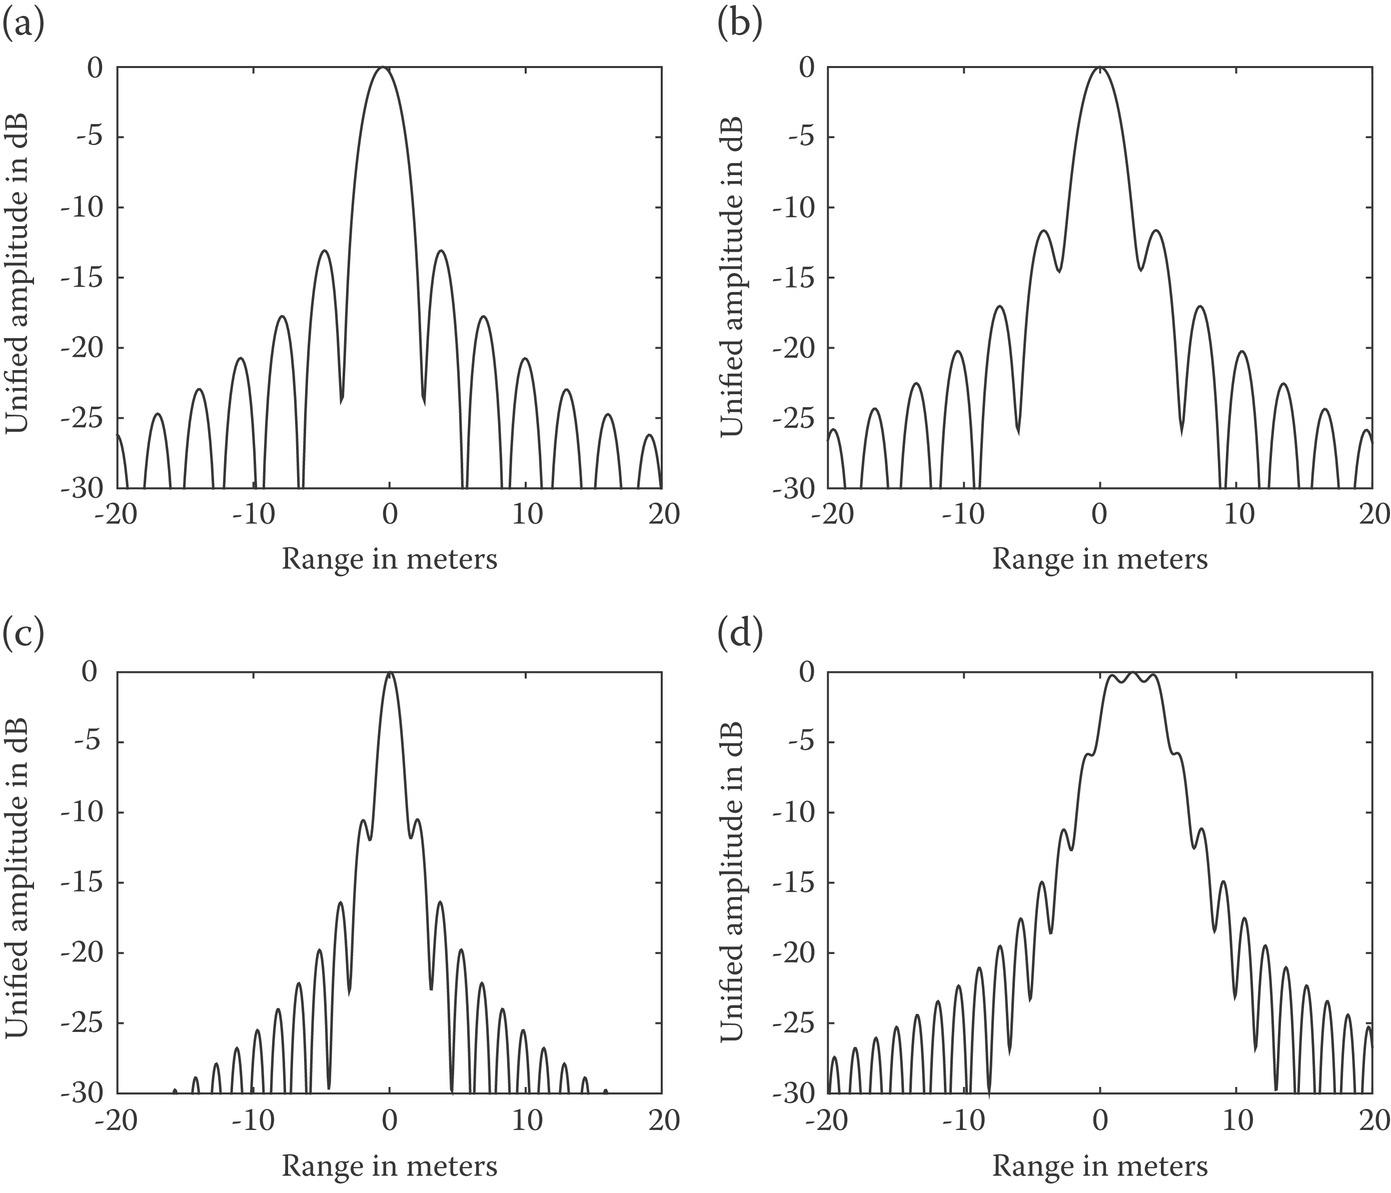
FIGURE 10.23 The 1-D range profile of point target response under the effect of the QPE with (a) B = 50 MHz, TEC0 = 50TECU; (b) B = 50 MHz, TEC0 = 150TECU; (c): B = 100 MHz, TEC0 = 50TECU; (d) B = 100 MHz, TEC0 = 150TECU.
TABLE 10.5
Numeric Measures of Image Quality of a Point Target Response in Range Direction due to QPE
| TEC0 = 50 TECU | TEC0 = 150 TECU | |||
| B = 50MHz | Ideal resolution (m) | 3.00 | Ideal resolution (m) | 3.00 |
| Real resolution (m) | 3.10 | Real resolution (m) | 3.04 | |
| PSLR (dB) | ‒13.07 | PSLR (dB) | ‒11.63 | |
| ISLR (dB) | ‒14.70 | ISLR (dB) | ‒10.88 | |
| B = 100MHz | Ideal resolution (m) | 1.50 | Ideal resolution (m) | 1.50 |
| Real resolution (m) | 1.55 | Real resolution (m) | 5.29 | |
| PSLR (dB) | ‒10.50 | PSLR (dB) | ‒5.76 | |
| ISLR (dB) | ‒10.00 | ISLR (dB) | ‒14.79 | |
Similarly, the cubical phase error (CPE) can be defined as
Equation 10.84 indicates that the CPE is proportional to the constant component of TEC and the cube of system bandwidth. In addition, the range CPE also strongly depends on the carrier frequency. When the CPE is larger than , the range imaging will be defocused. The CPE as a function of TEC0 with bandwidths from 10 MHz to 200 MHz is plotted in Figure 10.24. It reveals that the impact of the CPE has a lesser extent than that of the QPE. It can be observed that Moon-based SAR with a bandwidth smaller than 100 MHz is barely affected by the CPE. However, when the bandwidth of 200 MHz is chosen, the CPE begins to affect the range imaging with a TEC around 50 TECU. The range profiles affected by CPE with different TECs are plotted in Figure 10.25 (ignoring the range shift) and the corresponding evaluations are given in Table 10.6. The simulation results manifest that the CPE defocus range image with a system bandwidth of 200 MHz and TEC larger than 50 TECU. It is found that a ghost image appears in range direction due to the asymmetric distortion of the received signal on account of cubical phase error when the range imaging is impacted by the CPE. As checked in Table 10.6, the image quality is deteriorated by the CPE when range defocusing appears while the range resolution varies little.
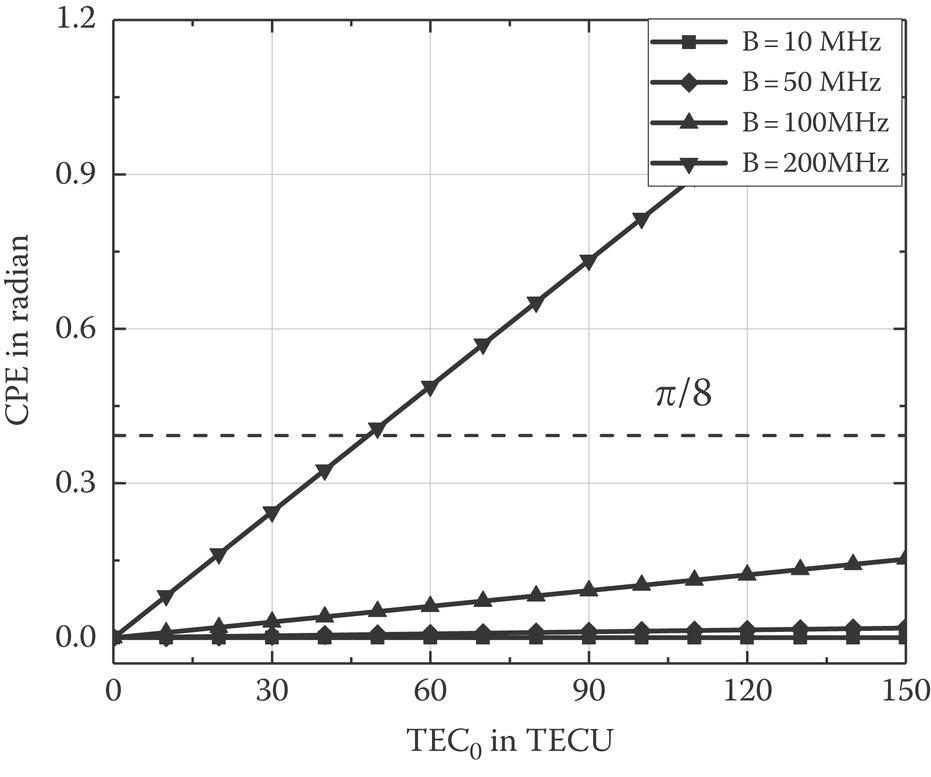
FIGURE 10.24 The cubical phase error (CPE) as a function of TEC0 with different bandwidths.
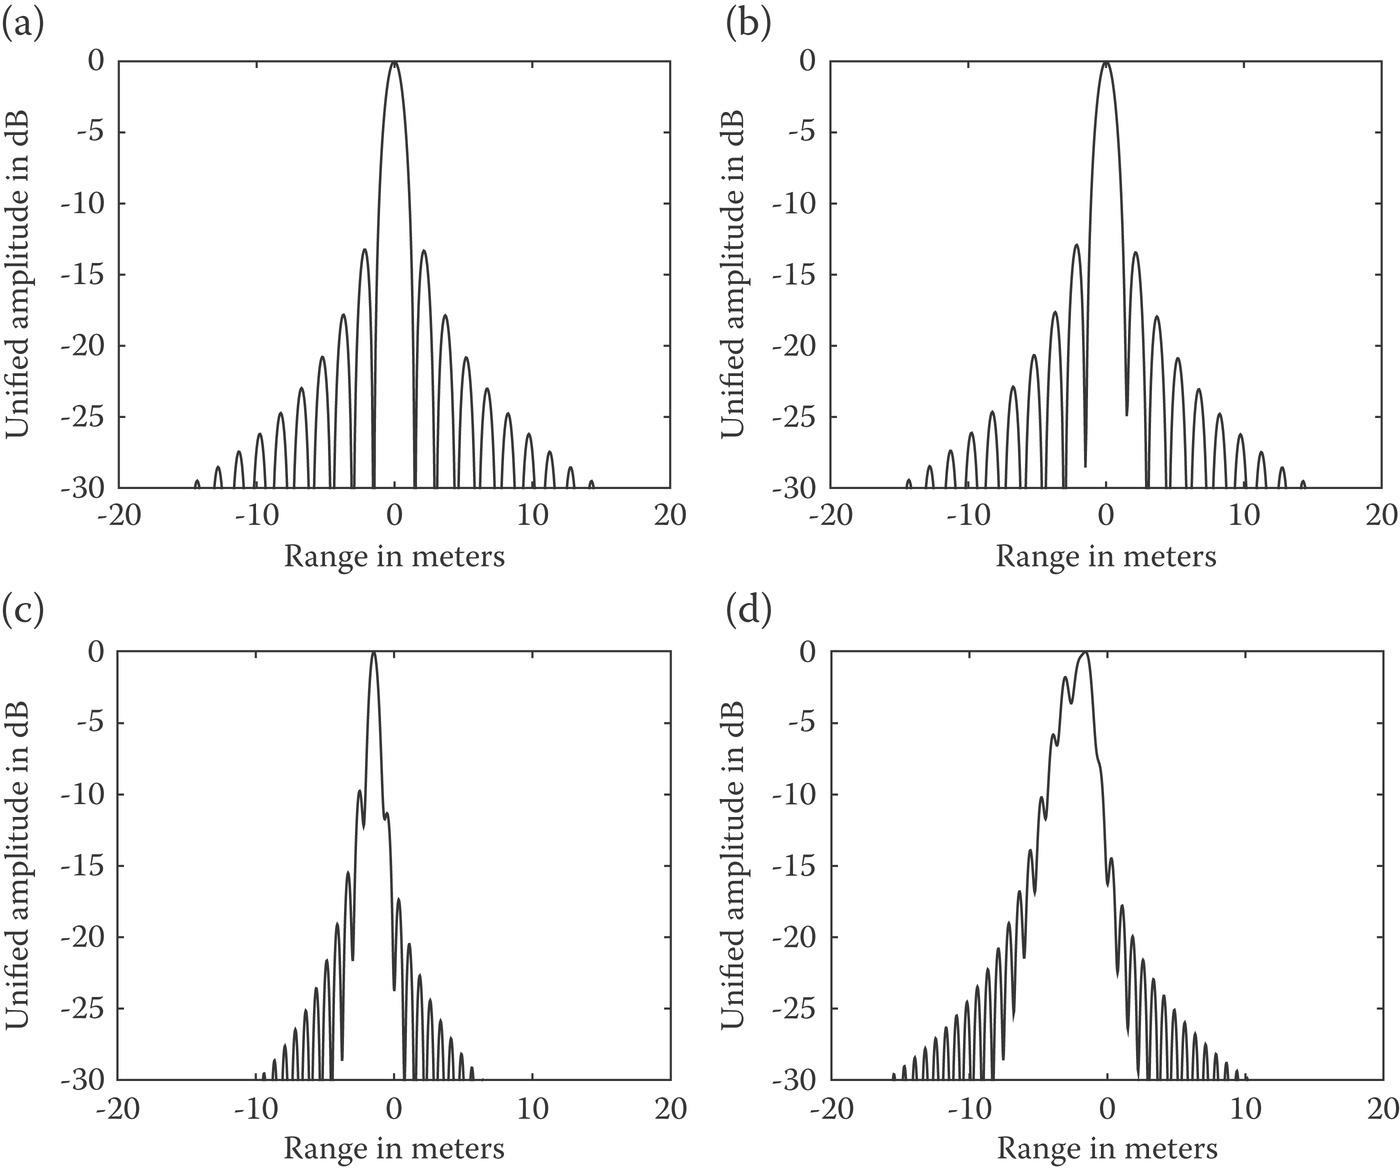
FIGURE 10.25 The 1-D range profile of point target response under the effect of the CPE with (a) B = 100MHz, TEC0 = 50TECU; (b) B = 100MHz, TEC0 = 150TECU; (c) B = 200MHz, TEC0 = 150TECU; (d) B = 200MHz, TEC0 = 150TECU.
TABLE 10.6
Numeric Measures of Image Quality of a Point Target Response in Range Direction due to CPE
| TEC = 50 TECU | TEC = 150 TECU | |||
| B=100MHz | Ideal resolution (m) | 1.50 | Ideal resolution (m) | 1.50 |
| Real resolution (m) | 1.55 | Real resolution (m) | 1.52 | |
| PSLR (dB) | ‒13.16 | PSLR (dB) | ‒12.91 | |
| ISLR (dB) | ‒15.08 | ISLR (dB) | ‒13.49 | |
| B=200MHz | Ideal resolution (m) | 0.75 | Ideal resolution (m) | 0.75 |
| Real resolution (m) | 0.78 | Real resolution (m) | 2.11 | |
| PSLR (dB) | ‒9.74 | PSLR (dB) | ‒1.77 | |
| ISLR (dB) | ‒9.91 | ISLR (dB) | ‒6.54 | |
Now consider the coupled effects of the QPE and CPE on imaging focus. To see this we simulate the 1-D range profile in Figure 10.26 (ignoring the range shift), and numeric quantities of resolution and image quality measures are listed in Table 10.7. When the effects of QPE and CPE on Moon-based SAR imaging are coupled—image quality is seriously deteriorated and the range resolution is degraded dramatically with the increasing of system bandwidth and TEC. Interestingly, the PSLR of a point target response due to the effects of the range QPE and CPE strongly depends on the TEC0 and system bandwidth.
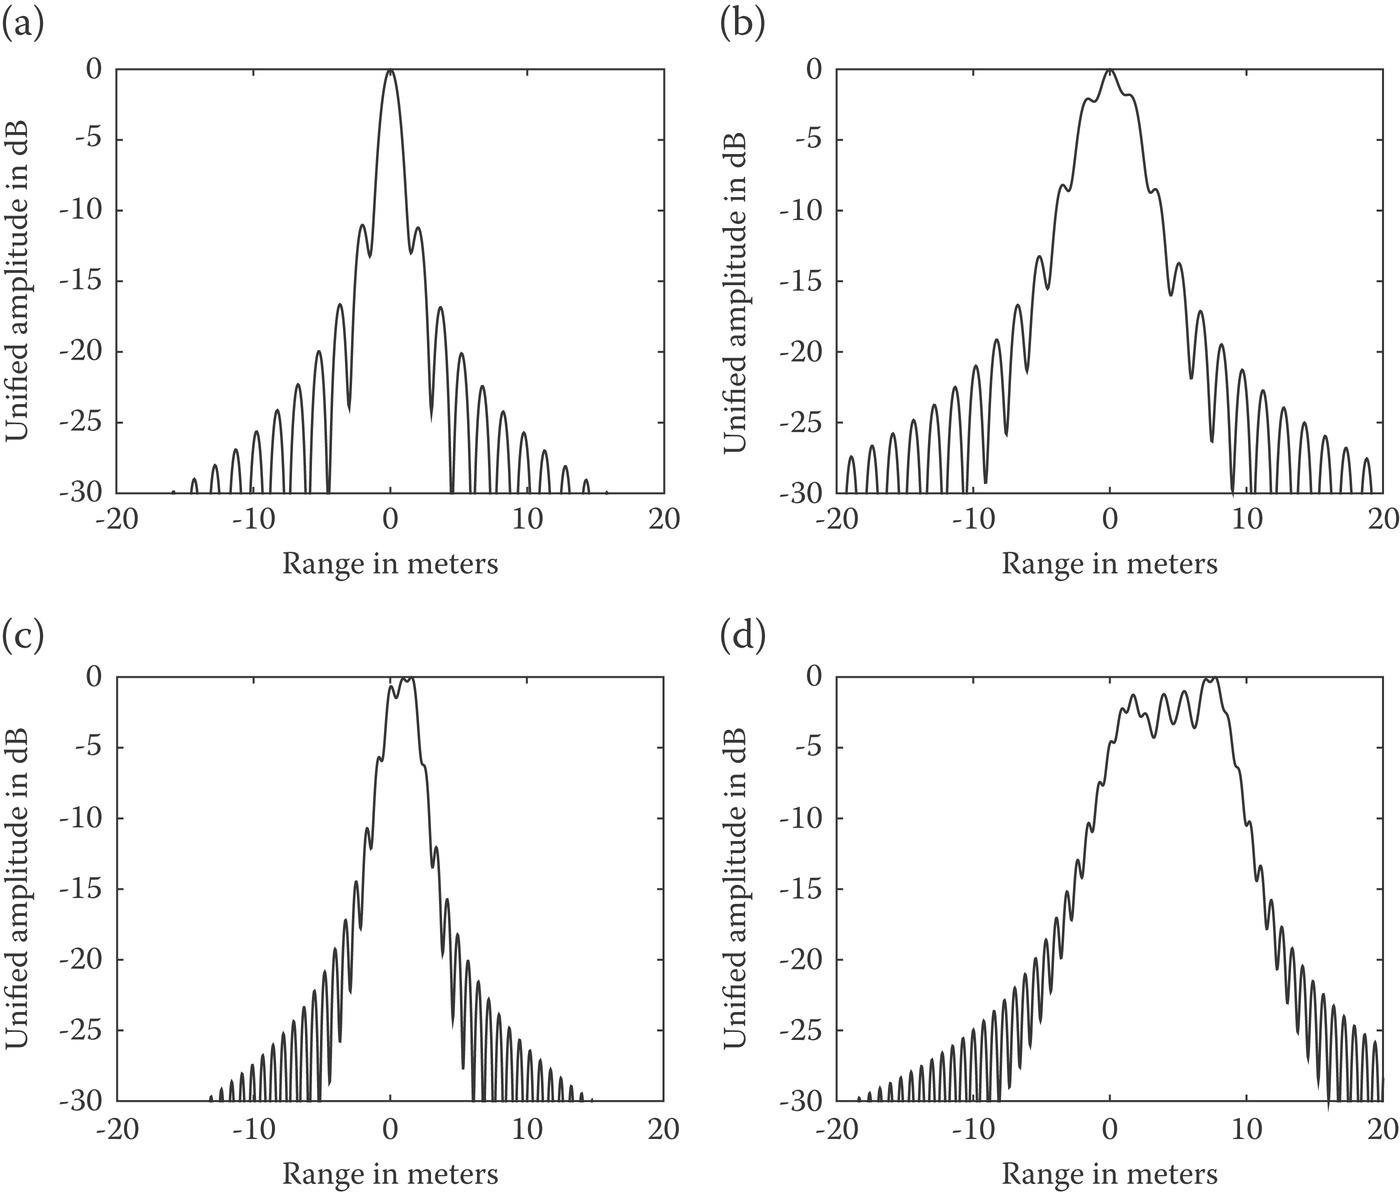
FIGURE 10.26 The 1-D range profile of point target response under the effects of the QPE and CPE with (a) B = 100MHz, TEC0 = 50TECU; (b) B = 100MHz, TEC0 = 150TECU; (c) B = 200MHz, TEC0 = 150TECU; (d) B = 200MHz, TEC0 = 150TECU.
TABLE 10.7
Numeric Measures of Image Quality of a Point Target Response in Range Direction due to QPE and CPE
| TEC = 50 TECU | TEC = 150 TECU | |||
| B = 100MHz | Ideal resolution (m) | 1.50 | Ideal resolution (m) | 1.50 |
| Real resolution (m) | 1.55 | Real resolution (m) | 4.51 | |
| PSLR (dB) | ‒11.02 | PSLR (dB) | ‒1.81 | |
| ISLR (dB) | ‒10.00 | ISLR (dB) | ‒14.63 | |
| B = 200MHz | Ideal resolution (m) | 0.75 | Ideal resolution (m) | 0.75 |
| Real resolution (m) | 2.61 | Real resolution (m) | 7.48 | |
| PSLR (dB) | ‒0.11 | PSLR (dB) | ‒0.16 | |
| ISLR (dB) | ‒9.67 | ISLR (dB) | ‒5.36 | |
Figure 10.27 shows the PSLR as a function of the TEC0 with different bandwidths, from which we observe that PSLR increases with the increase of the TEC0. Apart from that, there is a positive correlation between the PSLR and system bandwidths. It is desirable to compensate for the QPE and CPE when a meter scale of range resolution is required. Notice that at a range resolution of decametric level (B~10 MHz), both the QPE and CPE are not an issue.
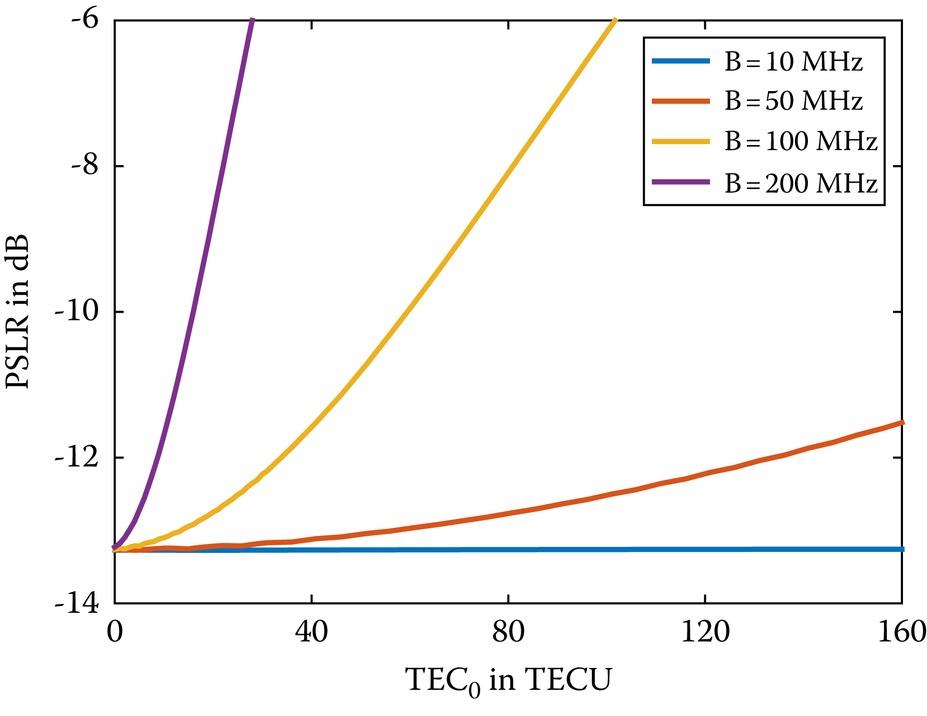
FIGURE 10.27 The PSLR as a function of the TEC0 with different bandwidths.
10.4.2 IONOSPHERIC EFFECTS ON AZIMUTH IMAGING
The azimuth compression term given in Equation 10.74 is just related to the change rate of the TEC over slow time at various orders (temporal gradient and spatial gradient of TEC) but has no connection with the constant component of TEC. The TEC derivatives with respect to slow time result in changes in the Doppler frequency and Doppler FM rate and thus give rise to the distortion of the azimuth imaging. The linear term of Equation 10.74 brings about image shift in azimuth direction due to the Doppler shift whereas the quadratic term and cubical term may lead to the azimuth defocusing if it is possible.
10.4.2.1 Azimuth Shift
The azimuth shift aroused by the Doppler shift can be expressed as
where , is the derivative of the slant range against the slow time at ith order, their specified expressions are given in [16]; is the relative velocity of the ground target in the context of lunar revolution on the rotating Earth, it is defined by
where the scale factor accounts the lunar revolution, taking the form
A closer look at Equation 10.85 indicates that the azimuth shift is related to the TEC temporal gradient, TEC spatial gradient, and the slant range expansion coefficients at various orders. Additionally, the azimuth shift is negatively correlated to the carrier frequency. Similar to the range shift caused by the temporal-spatial varying part of the background ionosphere, the azimuth shift is comprised of the azimuth shift caused by the spatial-varying part of the background ionosphere and induced by the temporal-varying part of the background ionosphere.
Figure 10.28 presents the azimuth shift caused by the temporal-varying, spatial-varying and temporal-spatial varying parts of the background ionosphere, from which we observe that the azimuth shift caused by the effects of the temporal-spatial varying background ionosphere is on the order of tens of meters and can be up to hundreds of meters under the ionospheric storm. In addition, the azimuth shift caused by the temporal-varying part of the background ionosphere is negatively connected with the Earth’s latitude. Yet the spatial-varying background ionosphere induced azimuth shift is in positive correlation with the Earth’s latitude. As for the Moon-based SAR’s declination, there is a positive correlation with the azimuth shifts caused by temporal-spatial varying background ionosphere.
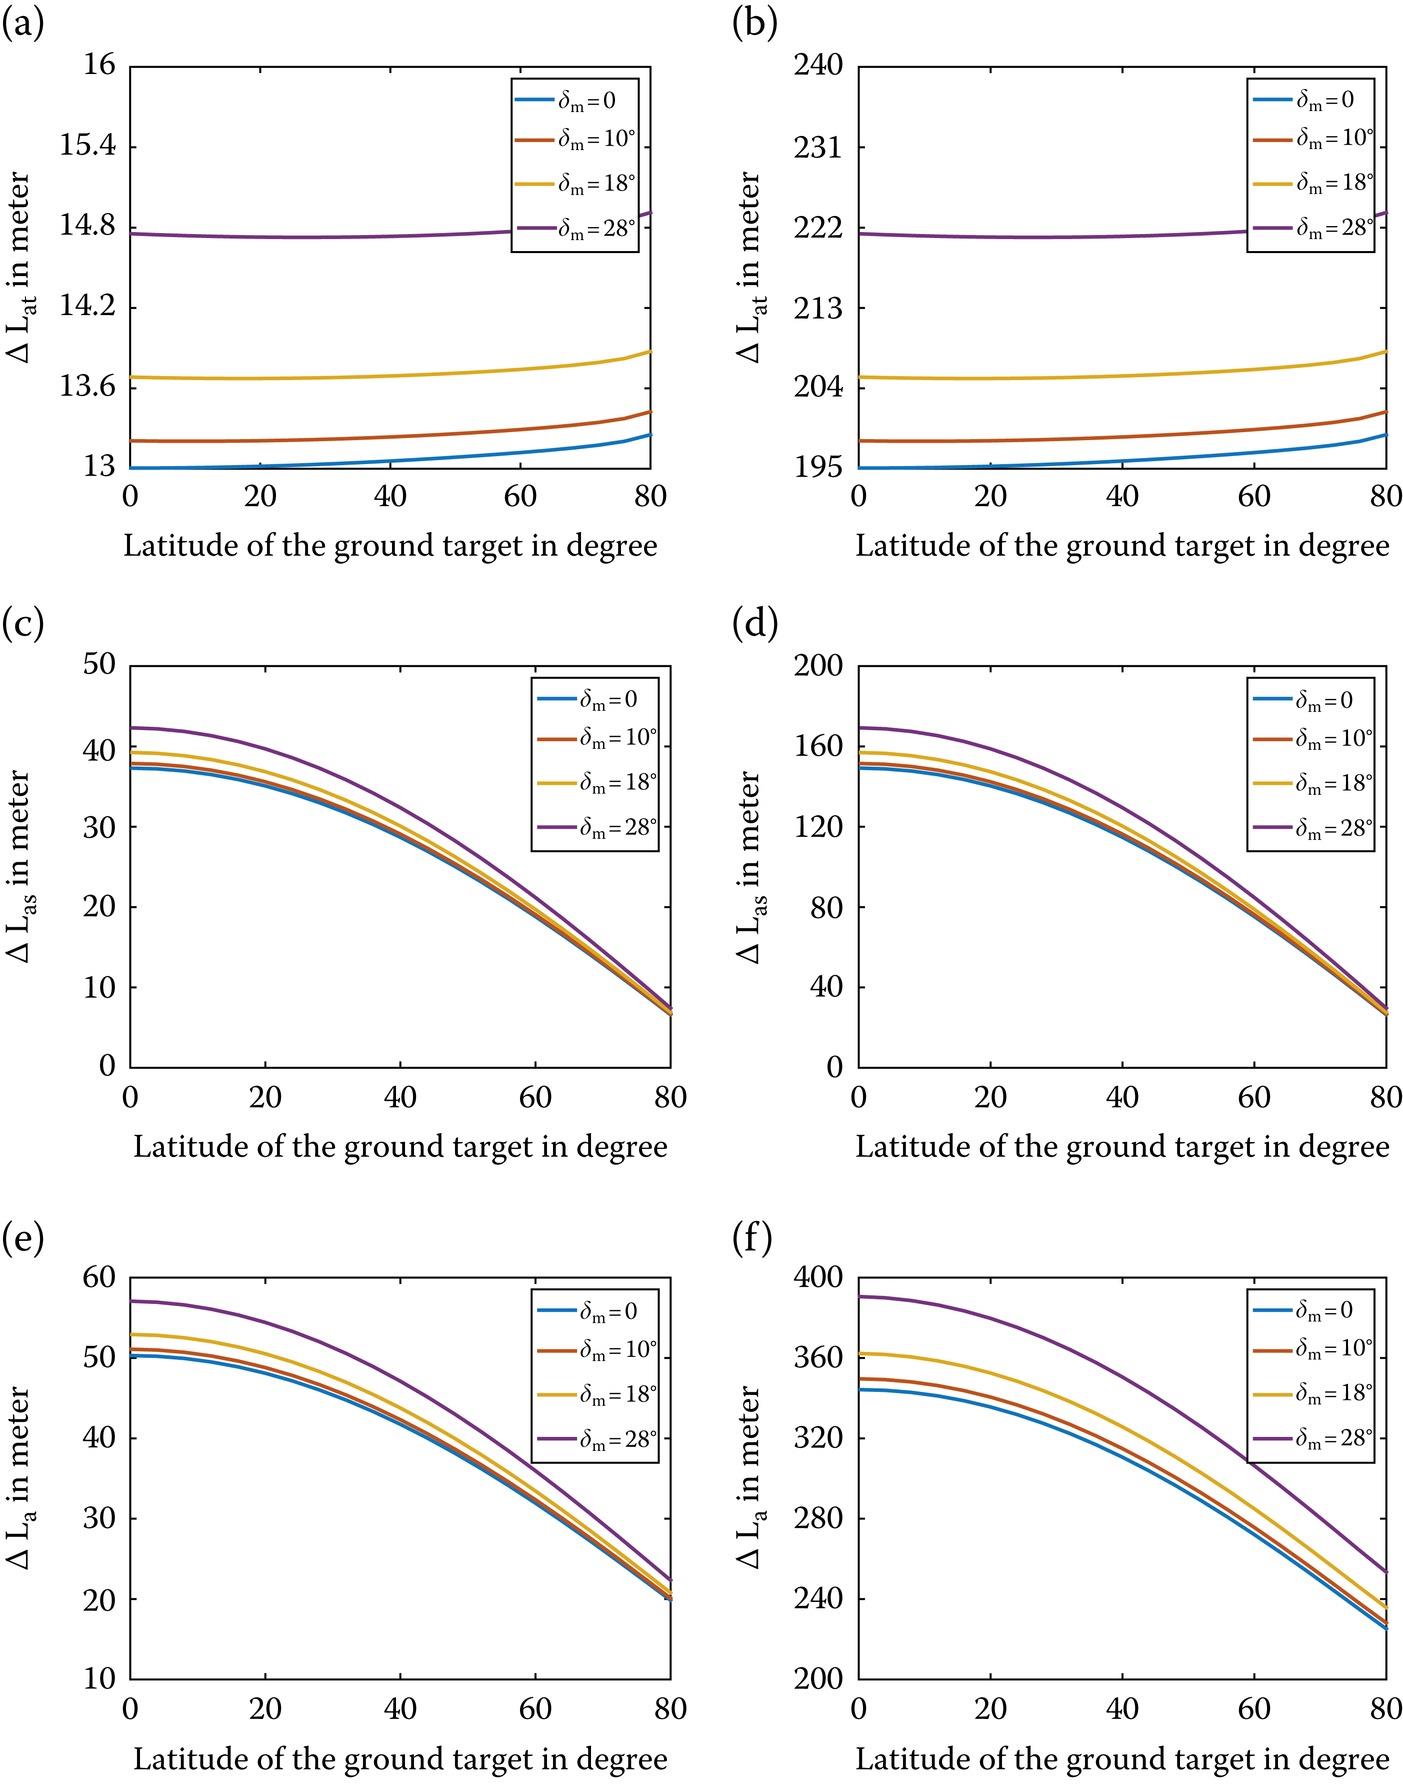
FIGURE 10.28 Azimuth shift caused by temporal-varying background ionosphere under (a) normal ionosphere, (b) ionospheric storm; the azimuth shift caused by spatial-varying background ionosphere under (c) normal ionosphere, (d) ionospheric storm; the azimuth shift caused by temporal-spatial varying background ionosphere under (e) normal ionosphere, (f) ionospheric storm.
Figure 10.28 presents the azimuth shift caused by the temporal-varying, spatial-varying and temporal-spatial varying parts of the background ionosphere, from which we observe that the azimuth shift caused by the effects of the temporal-spatial varying background ionosphere is on the order of tens of meters and can be up to hundreds of meters under the ionospheric storm. In addition, the azimuth shift caused by the temporal-varying part of the background ionosphere is negatively connected with the Earth’s latitude. Yet the spatial-varying background ionosphere induced azimuth shift, is in positive correlation with the Earth’s latitude. As for the Moon-based SAR’s declination, there is a positive correlation with the azimuth shifts caused by temporal- spatial varying background ionosphere.
Now that in Figure 10.29 we plot the 1-D azimuth profile of point target response under normal and storm. Ionospheres. For all cases, the exposure time is 200 s. For comparison 22.5° [see Figures 10.29(a), (b)] and 62.5° [see Figures 10.29(c), (d)] of Earth’s latitudes are shown. The azimuth shift extends from tens to hundreds of meters and varies with the relative position of the ground target and the Moon-based SAR. It can be observed that both the ground targets’ latitude and Moon-based SAR’s declination conceivably induce the azimuth shift. The spatial-varying TEC temporal gradient variations further give rise to an irregular pattern of the azimuth shift, making its prediction and compensation even more difficult if not impossible.
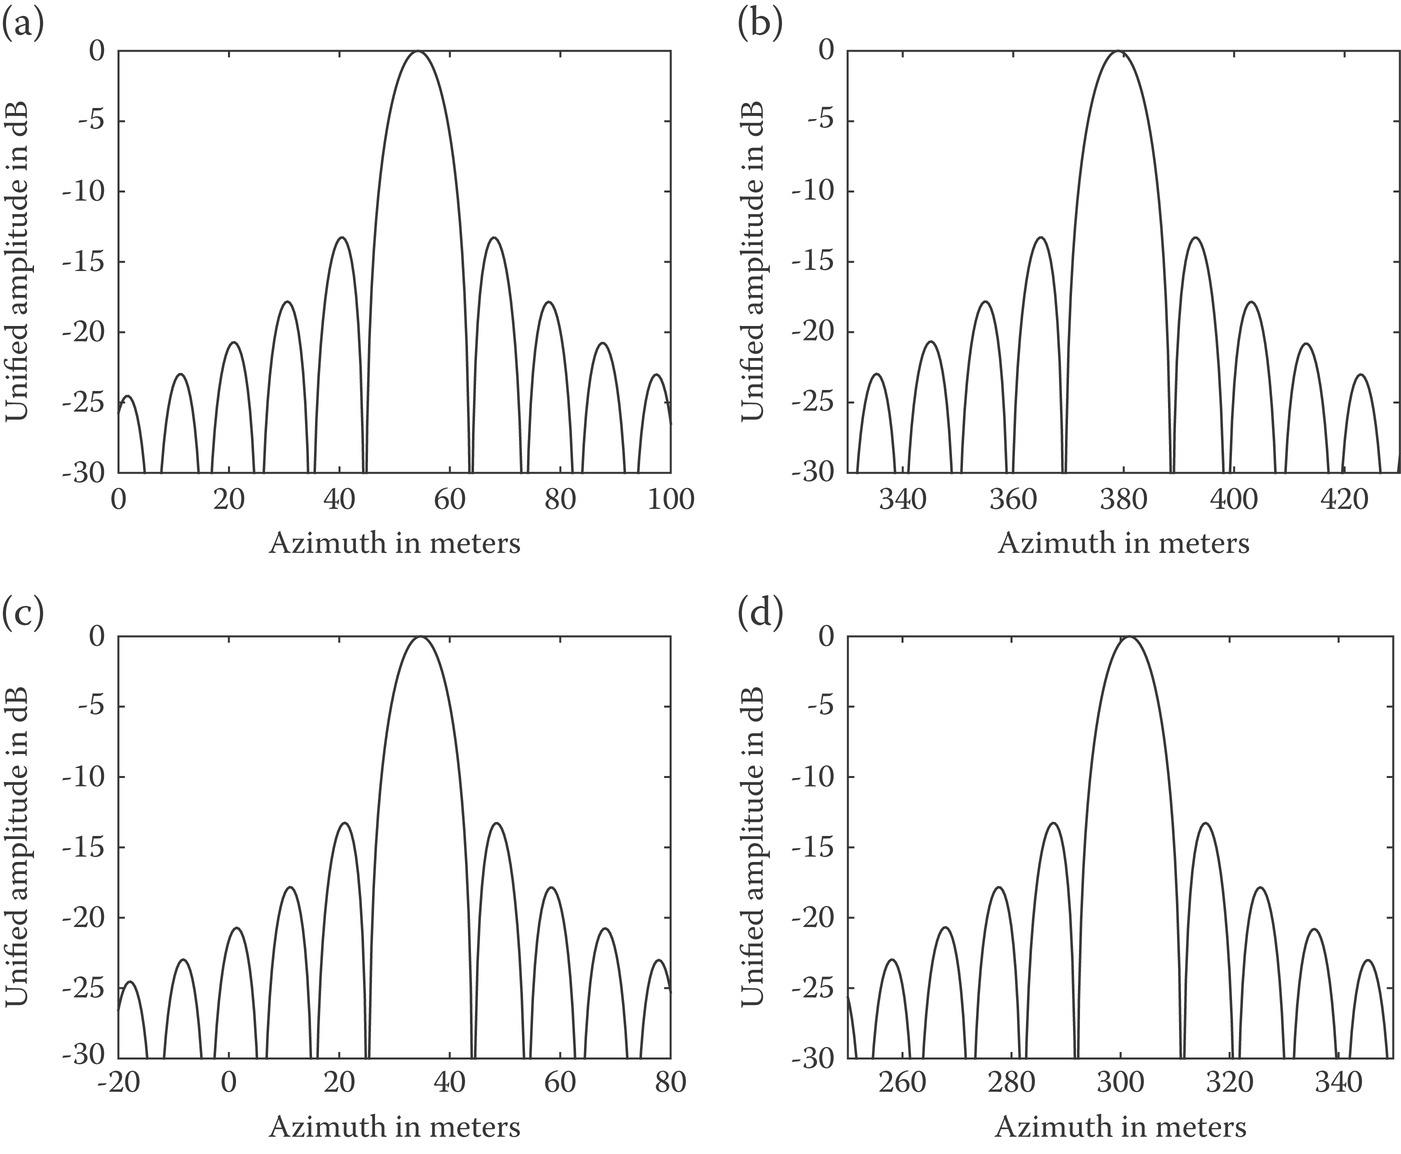
FIGURE 10.29 1-D azimuthal profile of point target response at 22.5°of latitude of under (a) normal ionosphere ΔLa = 54.01 m, (b) ionospheric storm ΔLa = 378.80m; and at 62.5° of the latitude under (c) normal ionosphere Δ La = 34.52m, (d) ionospheric storm Δ. La = 301.43m.
10.4.2.2 Azimuth Defocusing
The temporal-spatial varying background ionosphere causes both azimuth shift and azimuth defocusing. The quadratic and cubical terms in Equation 10.74 broaden the main lobe, raise the side-lobe, and cause azimuthal defocusing. Here the azimuth quadratic phase error () is given by
where is the Doppler frequency modulation rate, is the synthetic aperture time, with phase given by
Similarly, the azimuth cubical phase error () is defined as
where is expressed as
The typical thresholds of azimuth QPE and CPE are set to and , respectively. As can be checked from Equations 10.88 and 10.90, the azimuth QPE and CPE are closely related to the time change rate of ionospheric TEC and the synthetic aperture time, or equivalently the synthetic aperture length. Furthermore, the TEC spatial gradient can be expressed in the form of a change rate of the TEC over time. In Figure 10.30 we plot both phase errors as a function of change rate of TEC over time by using the simulation parameters given in Table 10.3, with a synthetic aperture time of 600 s, which corresponds to an azimuthal resolution around 3 meters. It is seen that both the azimuth QPE and CPE increase with the TEC temporal, but neither of them exceeds their respective thresholds even under a TEC gradient of 5 TECU/s, thus the azimuth imaging of the Moon-based SAR is not disturbed by azimuth QPE or CPE in such a situation.
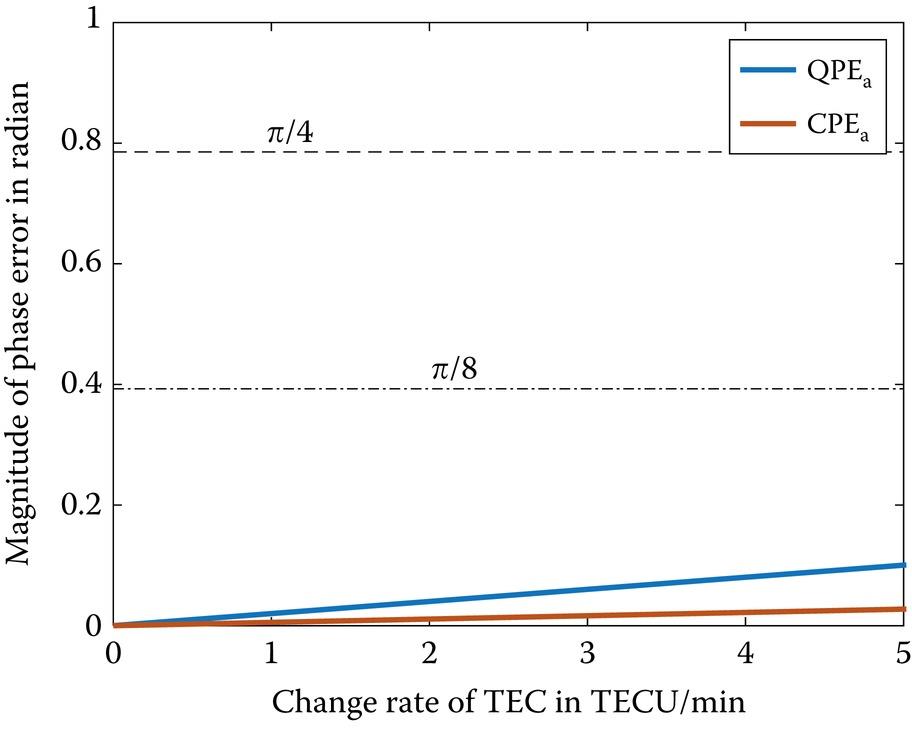
FIGURE 10.30 Azimuth QPE and CPE as a function of TEC temporal gradient with a synthetic aperture time of 600 s.
We now turn our attention to the magnitudes of the azimuth QPE and CPE at different Moon-based SAR’s declinations as a function of the Earth’s latitude. The synthetic aperture time is set to be 600 s and the ionospheric parameters are given: k1 = 3 TECU/min and s1 = 0.08 TECU/km. As detailed in Figure 10.31, the azimuth QPE has a dependency on the relative positions of the ground target’s latitude and Moon-based SAR’s declination where the azimuth CPE is independent of the relative positions. It can be identified that both the azimuth
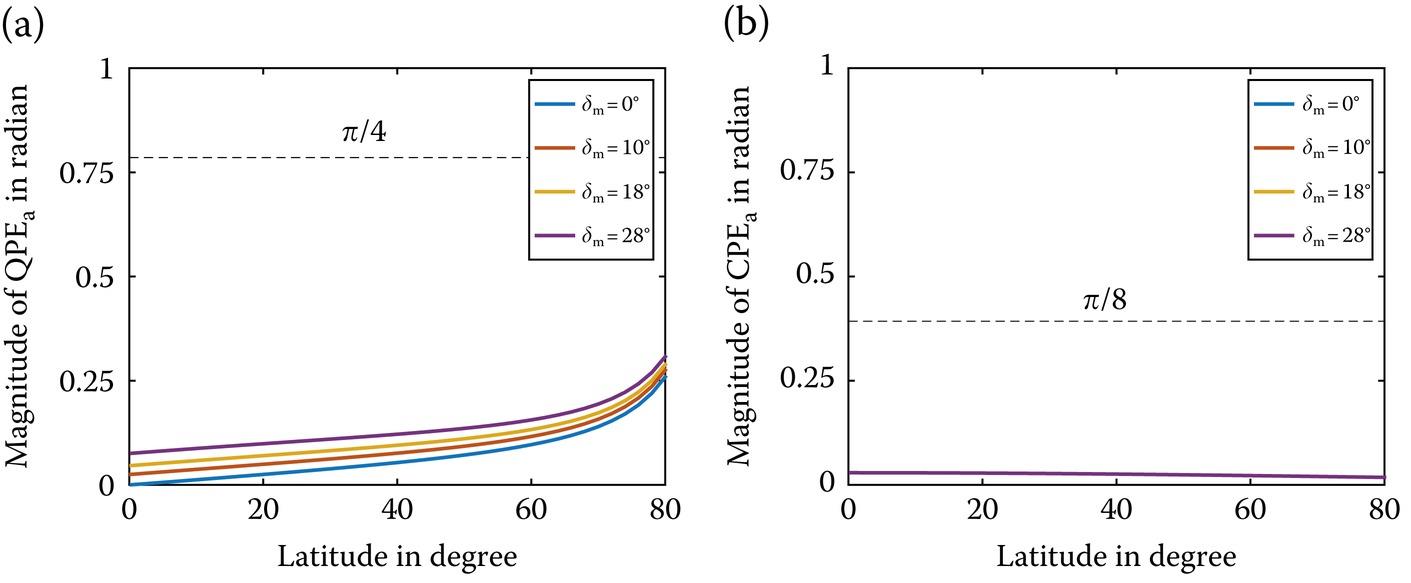
FIGURE 10.31 Azimuth phase errors as a function of Earth’s latitude with a synthetic aperture time of 600 s: (a) azimuth QPE, (b) azimuth CPE.
QPE and CPE are smaller than their thresholds, suggesting that the azimuth focusing is not affected by neither of them wherever the Moon-based SAR and ground target locate.
For a more rigorous check, we simulate the 1-D azimuthal profile of point target response at the Earth’s latitude of 22.5°and 67.5° under the influence of the azimuthal QPE and CPE in Figure 10.32, with synthetic aperture time of 600 s. The ionospheric cases are the same as Figure 10.31 while the simulation parameters are given in Table 10.3. The magnitude of azimuthal QPE and CPE and numeric measures of image quality are summarized in Table 10.8. It is found that there is no sign of defocusing in azimuth imaging at low and high latitudes, even though the synthetic aperture time is up to 600 s. At this point, it may be argued that the background ionospheric effects hardly defocus the azimuth imaging of the Moon-based SAR with an azimuthal resolution larger than 3 meters.
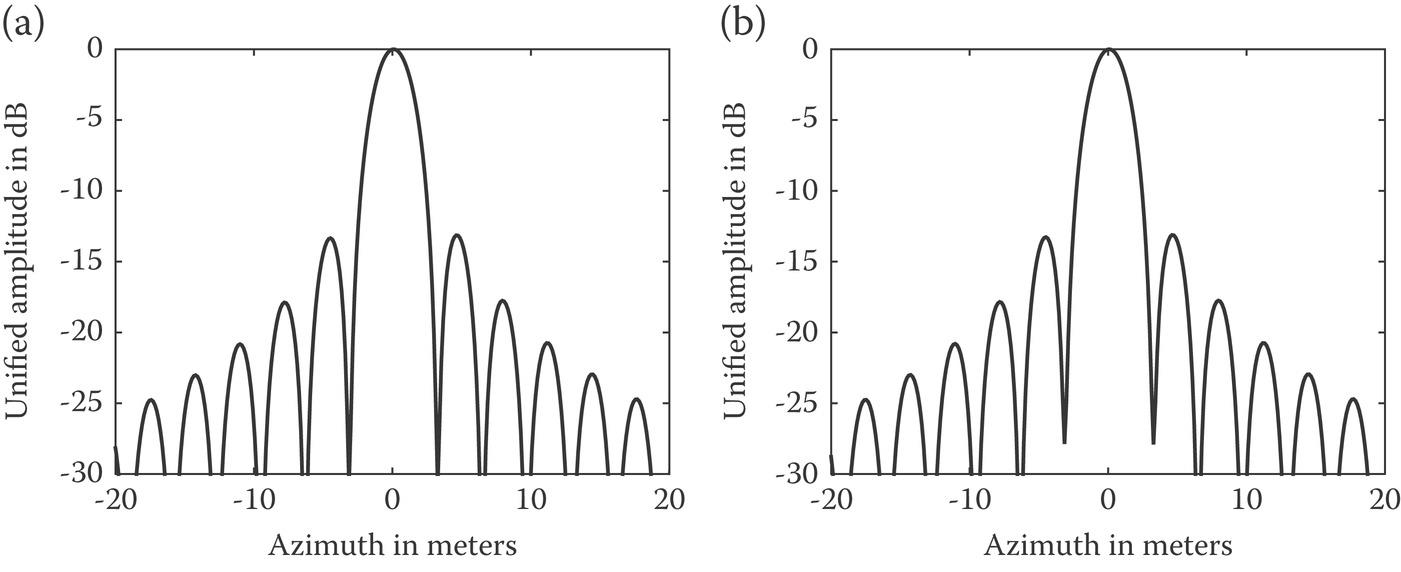
FIGURE 10.32 1-D azimuthal profile of point target response under the effects of azimuth QPE and CPE with a synthetic aperture time of 600s at the Earth’s latitude of (a) 22.5° (b) 67.5°.
TABLE 10.8
Numeric Measures of Image Quality of a Point Target Response in Azimuth Direction due to Azimuth QPE and CPE
| QPEa (rad) | ‒0.1031 | QPEa (rad) | ‒0.1826 |
| CPEa (rad) | 0.0281 | CPEa (rad) | 0.0208 |
| Ideal resolution (m) | 3.20 | Ideal resolution (m) | 3.20 |
| Real resolution (m) | 3.24 | Real resolution (m) | 3.25 |
| PSLR (dB) | ‒13.14 | PSLR (dB) | ‒13.12 |
| PSLR (dB) | ‒13.68 | PSLR (dB) | ‒13.59 |
| QPEa (rad) | ‒0.1031 | QPEa (rad) | ‒0.1826 |
| CPEa (rad) | 0.0281 | CPEa (rad) | 0.0208 |
10.5 IMAGE SIMULATIONS AND ERROR ANALYSIS
Reminding that the background ionosphere is temporal-spatial varying which embodies in the diversity of ionospheric TEC and temporal and spatial gradients of TEC at different locations within the same imaging scene. To gain a more complete picture, we perform image simulations to examine the image quality in range and azimuth directions, using point targets and extended target.
10.5.1 IMAGING OF POINT TARGETS
Three point targets placed in the image scene, forming a triangular setting with two along azimuth direction and another in range direction. Their relative positions and system parameters are given in Table 10.9. The simulation results are shown in Figure 10.33, and numeric measures of image shift and image quality are listed in Table 10.10.
TABLE 10.9
Simulation Parameters of Three Point Targets at Different Positions
| Parameter | Point 1 | Point 2 | Point 3 |
| Position (km) | (‒50,0) | (50,0) | (0,50) |
| TEC0 (TECU) | 20 | 50 | 150 |
| TEC temporal gradient (TECU/s) | 0.001 | ‒0.003 | 0.05 |
| TEC spatial gradient (TECU/km) | ‒0.005 | 0.03 | 0.07 |
| System bandwidth (MHz) | 50 (~ground range resolution of 28 m) | ||
| synthetic aperture time (s) | 70 (~azimuth resolution of 27.4 m) | ||
| Latitude of ground target | 22.5° | ||
| Declination of Moon-based SAR | 28.5° | ||
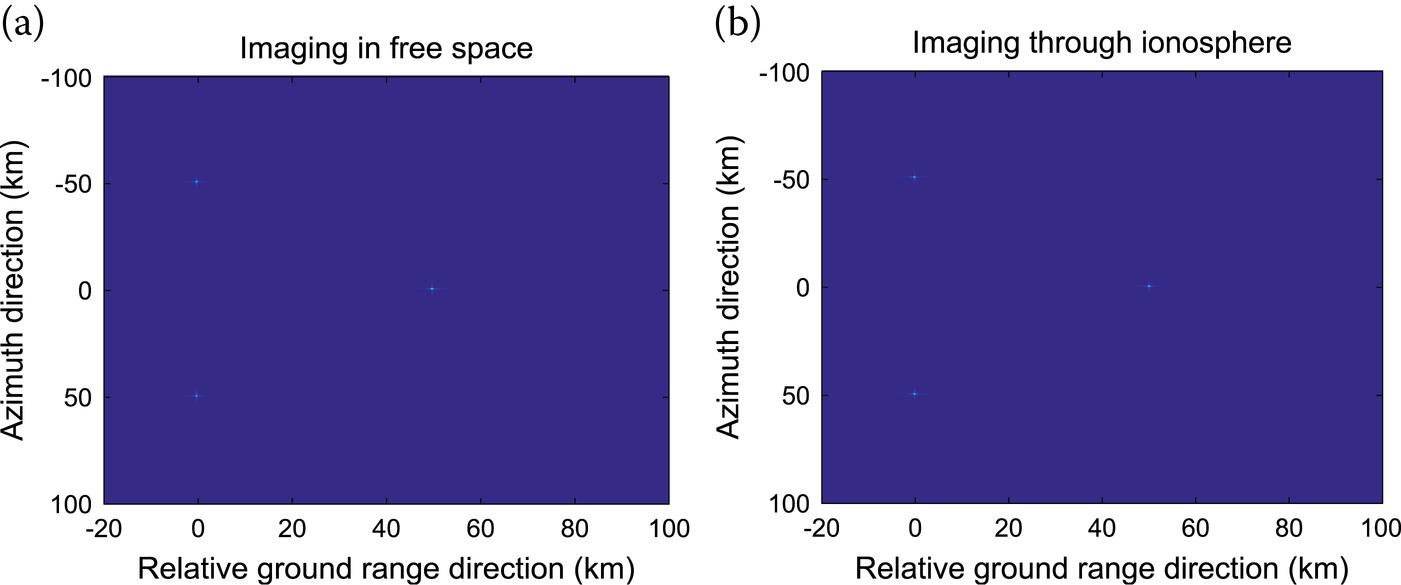
FIGURE 10.33 The multi-points’ imaging (a) in free space; (b) through ionosphere (The ionosphere is exaggerated for the purpose of illustration.).
TABLE 10.10
Numeric Measures of Image Quality of Point Targets Response
| Point 1 | Point 2 | Point 3 | ||
| Range | Image shift (m) | 58.89 | 133.43 | 404.94 |
| Ideal resolution (m) | 3.00 | 3.00 | 3.00 | |
| Real resolution (m) | 3.10 | 3.04 | 3.04 | |
| PSLR (dB) | ‒13.23 | ‒13.05 | ‒11.72 | |
| ISLR (dB) | ‒13.71 | ‒13.36 | ‒11.14 | |
| Azimuth | Image shift (m) | ‒5.36 | 45.49 | 359.19 |
| Ideal resolution (m) | 27.41 | 27.41 | 27.41 | |
| Real resolution (m) | 28.12 | 28.12 | 28.12 | |
| PSLR (dB) | ‒13.15 | ‒13.15 | ‒13.15 | |
| ISLR (dB) | ‒13.70 | ‒13.70 | ‒13.70 | |
It can be perceived from Table 10.10 that the image shift and image defocusing are spatially dependent and are determined by the locally varying ionospheric TEC. Thus the temporal-spatial varying background ionosphere produces a certain amount of image shift and image distortion on the single-point response. However, results in Figure 10.33 reveal that the three point targets, which form in triangular, in the image varies little simply because the image shift of each three point targets is negligibly small within the image scene. As we have already known from previous analysis, the temporal and spatial variations of background ionosphere are slow and continuous processes and they are not so extreme in practice as we assumed in the simulation. Consequently, the overall image distortion caused by the spatial-variation image shift may be ignored.
10.5.2 IMAGING OF EXTENDED TARGET
The examination of the background ionospheric effects on the imaging of the extended area is in order. The total electron content and the change rate of TEC over time and space are assumed constant since the coverage of the earth’s surface is relatively small. The digital elevation model (DEM) is shown in Figure 10.34(a), and the corresponding simulated SAR image in free space is shown in Figure 10.34(b), while imaging through ionosphere with different ionospheric conditions are plotted in Figure 10.34(c) and (d), where the ground range resolution and azimuth resolution are set to 112.3 and 100.0 meters, respectively. It is clear that the background ionospheric effects show a distinct influence on a hundred meters level Moon-based SAR imaging. Though the image focusing seems not much disturbed by the background ionospheric effects, the image shift is significant, particularly at high TEC, implying that geometric correction and calibration are critical in the context of the Moon-based SAR imaging of Earth.
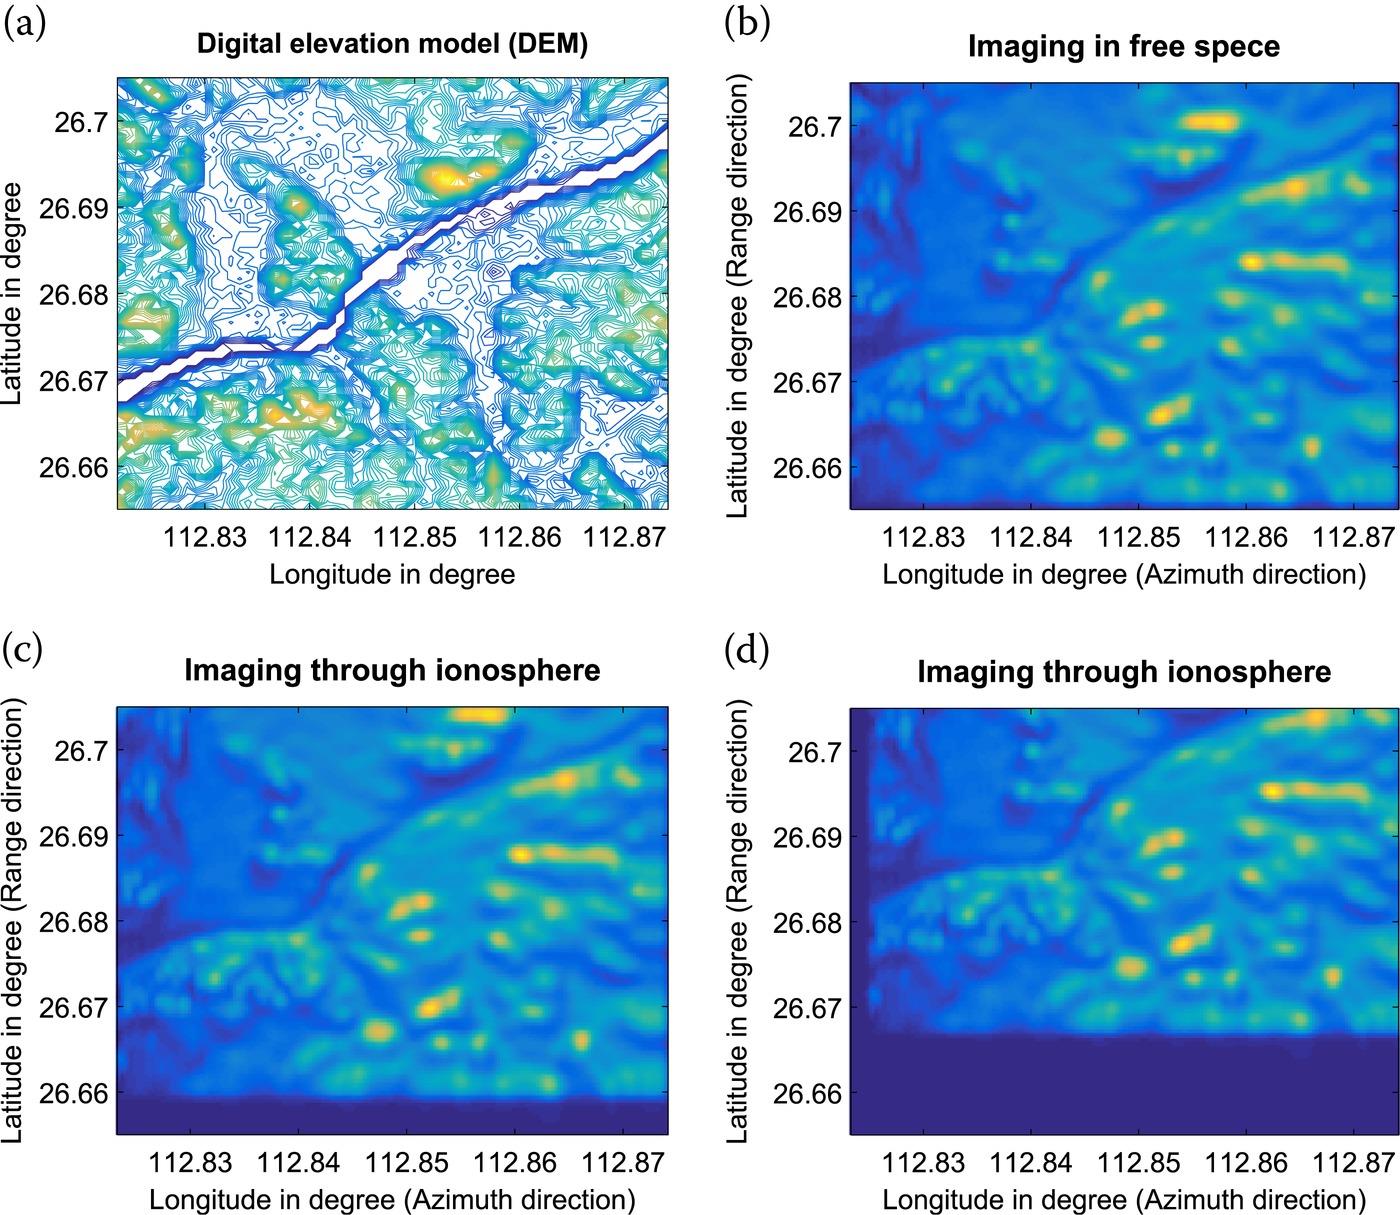
FIGURE 10.34 (a) Digital elevation model of the earth’s surface; (b) Imaging in free space. Imaging through ionosphere with (c) under normal ionosphere, (d) during ionospheric storm.
The background ionospheric effects on the geometric quality and fidelity of Moon-based SAR system are investigated in this paper. In so doing, a signal model considering background ionospheric effects for the Moon-based SAR based on a curved trajectory is established. Simulation results show that the range shift is on the order of hundreds of meters while the magnitude of the azimuth shift under normal solar activity condition is an order of ten meters. The image focusing by a Moon-based SAR with a scale of decameter is barely affected by the background ionospheric effects. It is found that background ionospheric effects seem not to defocus the azimuthal imaging in Moon-based SAR with an azimuthal resolution larger than 3 meters. When a geomagnetic storm occurs, which is closely related to the solar cycle, the azimuth shift can be even up to hundreds of meters, which is unacceptable for most applications.
The background ionospheric effects defocus the range imaging with a metric scale resolution. Further delving deeper into the ionospheric scintillation effects on Moon-based SAR imaging should be attempted in the future study. It is remarked that since the image quality is affected through phase distortion due to the ionospheric variations, the Moon-based SAR would potentially be an alternative to map the high-density spatiotemporal ionospheric disturbance.
References
1. Campbell, J. B., and Wynne, R. H., Introduction to Remote Sensing, Guilford Press, New York, 2011.
2. Johnson, J., Lucey, P., Stone, T., and Staid, M., Visible/near-infrared remote sensing of Earth from the moon. In NASA Advisory Council Workshop on Science Associated with the Lunar Exploration Architecture White Papers; 2007. Available online: http://www.lpi.usra.edu/meetings/LEA/whitepapers/Johnson_etal_v02.pdf (accessed on 19 July 2017).
3. Renga, A., Configurations and Performance of Moon-based SAR Systems for very high-resolution Earth remote sensing. In Proceedings of the AIAA Pegasus Aerospace Conference, Naples, Italy, 12–13 April 2007.
4. Renga, A., and Moccia, A., Preliminary analysis of a Moon-based interferometric SAR system for very high-resolution Earth remote sensing. In Proceedings of the 9th ILEWG International Conference on Exploration and Utilisation of the Moon, Sorrento, Italy, 22–26 October 2007.
5. Moccia, A., and Renga, A., Synthetic aperture radar for earth observation from a lunar base: Performance and potential applications. IEEE Transactions on Aerospace Electronic Systems, 2010, 46(3), 1034–1051.
6. Fornaro, G., Franceschetti, G., Lombardini, F., Mori, A., and Calamia, M., Potentials and limitations of moon-borne SAR imaging, IEEE Transactions on Geoscience and Remote Sensing, 48(7), 3009–3019, 2010.
7. Purkis, S. J., and Klemas, V. V., Remote Sensing and Global Environmental Change, John Wiley & Sons, Chichester, West Sussex, UK, 2011.
8. Elachi, C., Spaceborne Radar Remote Sensing: Applications and Techniques, IEEE Press, New York, 1988.
9. Guo, H. D., Ding, Y. X., Liu, G., Zhang, D. W., Fu, W. X., and Zhang, L., Conceptual study of lunar-based SAR for global change monitoring. Science China Earth Sciences 57, 1771–1779. 2014
10. Guo, H. D., Liu, G., and Ding, Y. X., Moon-based earth observation: scientific concept and potential applications, International Journal of Digital Earth, 11(6), 546–557, 2018.
11. Ouyang, Z. Y., Introduction to Lunar Science, China Astron Publishing House, Beijing, China, 2005.
12. Chen, K. S., Principles of Synthetic Aperture Radar Imaging: A System Simulation Approach, CRC Press, Boca Raton, FL, 2016.
13. Xu, Z., and Chen, K. S., Temporal-spatial varying background ionospheric effects on the moon-based synthetic aperture radar imaging: a theoretical analysis, IEEE Access, 6, 66767–66786, June, 2018.
14. Folkner, W. M., Williams, J. G., Boggs, D. H., Park, R. S., and Kuchynka, P., The Planetary and Lunar Ephemerides DE430 and DE431, Interplanetary Network Progress Report, 42–196, 1–81, February 2014.
15. Xu, Z., and Chen, K. S., Effects of the Earth’s curvature and lunar revolution on the imaging performance of the moon-based synthetic aperture radar, IEEE Transactions on Geoscience and Remote Sensing, 57(8), 5868–5882, August 2019.
16. Xu, Z., and Chen, K. S., On signal modeling of moon-based sar imaging of earth, Remote Sensing, 10(3), 486, March 2018. doi:10.3390/rs10030486.
17. Ye, H., Guo, H., Liu, G., and Ren, Y., Observation scope and spatial coverage analysis for earth observation from a moon-based platform, International Journal of Remote Sensing, 39((18)), 1–25, October 2017. doi:10.1080/01431161.2017.1395976.
18. Montenbruck, O., and Gill, E., Satellite Orbits: Models, Methods and Applications, Springer, Berlin, 2012.
19. Xu, Z., Chen, K. S., Liu, G., and Guo, H. D., Spatiotemporal coverage of a moon-based synthetic aperture radar: theoretical analyses and numerical simulations. IEEE Transactions on Geoscience and Remote Sensing, 19, 1–16, May. doi:10.1109/TGRS.2020.2990433
20. Gutzwiller, M. C., Moon-Earth-Sun: The oldest three-body problem, Reviews of Modern Physics, 70(2), 589–639, April 1998.
21. Moreira, A., Real-time Synthetic Aperture Radar (SAR) processing with a new subaperture approach, IEEE Transactions on Geoscience and Remote Sensing, 30(4), 714–722, July 1992.
22. Gutzwiller, M. C., Moon-Earth-Sun: The Oldest Three-Body Problem, Reviews of Modern Physics, 70(2), 589–639, April 1998.
23. Quegan, S., and J. Lamont, Ionospheric and tropospheric effects on synthetic aperture radar performance. International Journal of Remote Sensing, 7(4), 525–539, April 1986.
24. Stern, S. A., The lunar atmosphere: History, status, current problems, and context. Review of Geophysics, 37(4), 453–492, November 1999.
25. Wright, P. A., Quegan, S., Wheadon, N. S., and Hall, C. D. Faraday rotation effects on L-band spaceborne SAR data, IEEE Transactions on Geoscience and Remote Sensing, 41(12), 2735–2744, December 2003.
26. Hu, C., Tian, Y., Yang, X., Zeng, T., Long, T., and Dong, X., Background ionosphere effects on geosynchronous sar focusing: Theoretical analysis and verification based on the BeiDou Navigation Satellite System (BDS). IEEE Journal of Selected Topics in Applied Earth Observations and Remote Sensing, 9, 1143–1162, March 2016.
27. Ishimaru, A., Kuga, Y., Liu, J., Kim, Y., and Freeman, T., Ionospheric effects on synthetic aperture radar at 100 MHz to 2 GHz. Radio Science, 34(1), 257–268, October 1999.
28. Liu, J., Kuga, Y., Ishimaru, A., and Pi, X., Ionospheric effects on SAR imaging: A numerical study, IEEE Transactions on Geoscience and Remote Sensing, 41(51), 939–947, 2003.
29. Heliospheric Physics Lab of NASA/GSFC, International Reference Ionosphere (IRI 2012), May, 23, 2017 [Online]. Available: http://iri.gsfc.nasa.gov/.
30. GIPP in Academy of Opto-electronics of Sciences, Global ionospheric VTEC map produced based on real time GNSS data,” July 27, 2014 [Online]. Available: http://www.gipp.org.cn/
31. Lawrence, R. S., Little, C. G., and Chivers, H. J. A., A survey of ionospheric effects upon earth-space radio propagation. Proceedings of the IEEE, 52(1), 4–27, January 1964.
32. Xu, Z., and Chen, K. S., Temporal-spatial varying background ionospheric effects on the moon-based synthetic aperture radar imaging: A theoretical analysis, IEEE Access, 6, 66767–66786, July 2018. doi:10.1109/ACCESS.2018.2853163.
33. Cumming, I. G., and Wong, F. H., Digital Signal Processing of Synthetic Aperture Radar Data: Algorithms and Implementation, Artech House, Boston, MA, 2005.
34. Wang, C., Zhang, M., Xu, Z. W., Chen, C., and Guo, L. X., Cubic phase distortion and irregular degradation on SAR imaging due to the ionosphere, IEEE Transactions on Geosciences and Remote Sensing, 53(6), 3442–3451, 2015.
35. Jehle, M., Frey, O., Small, D., and Meier, E., Measurement of ionospheric TEC in spaceborne SAR data, IEEE Transactions on Geoscience and Remote Sensing, 48(6), 2460–2468, June 2010.