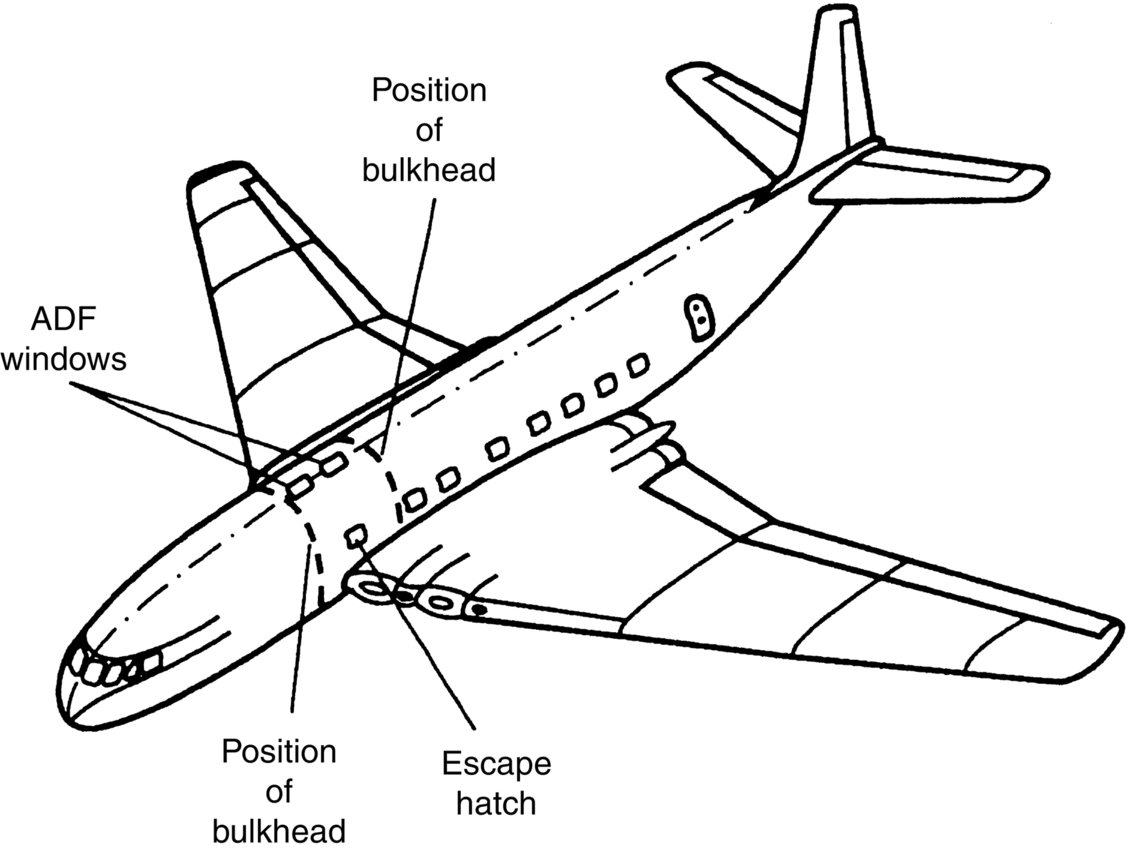
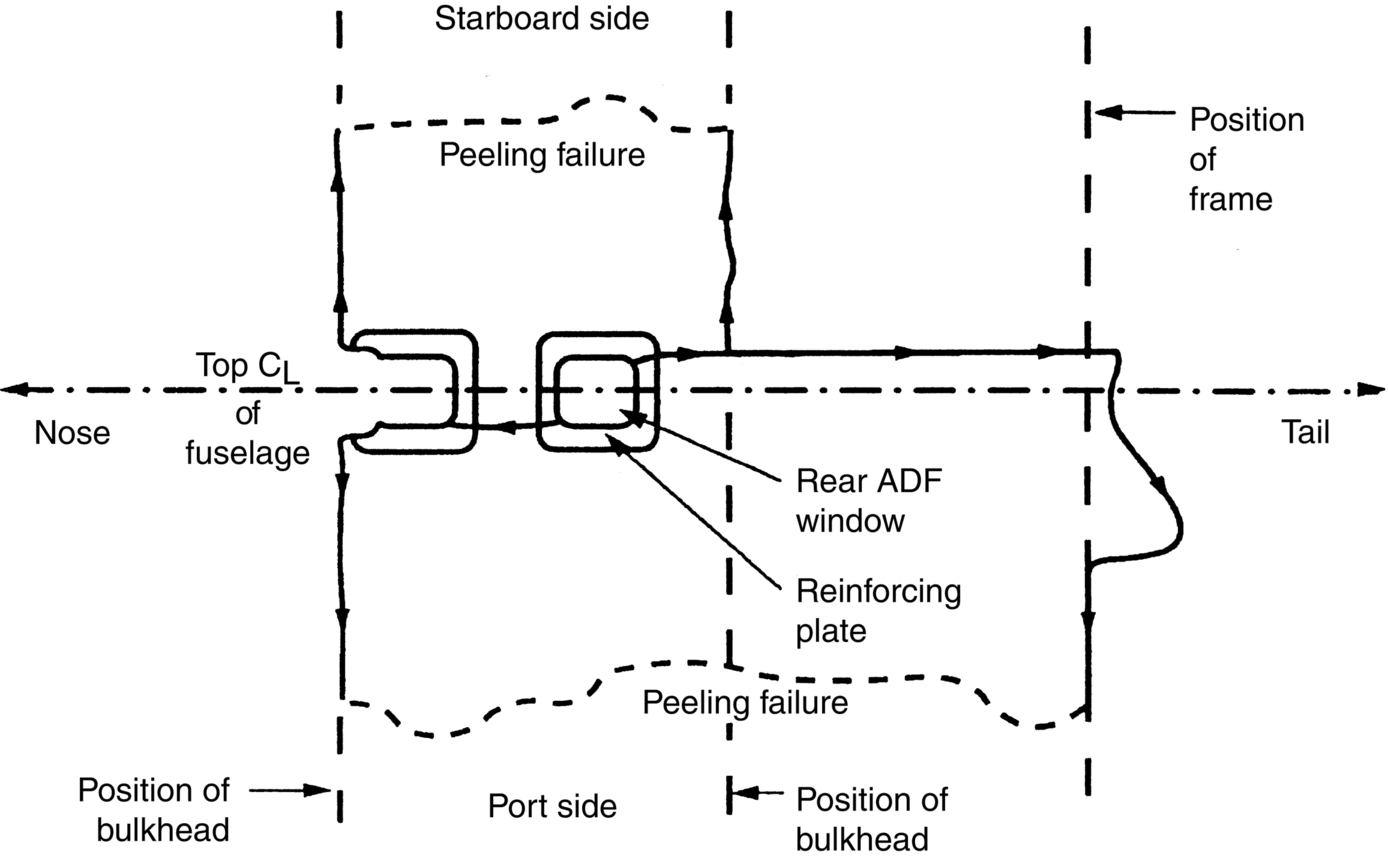
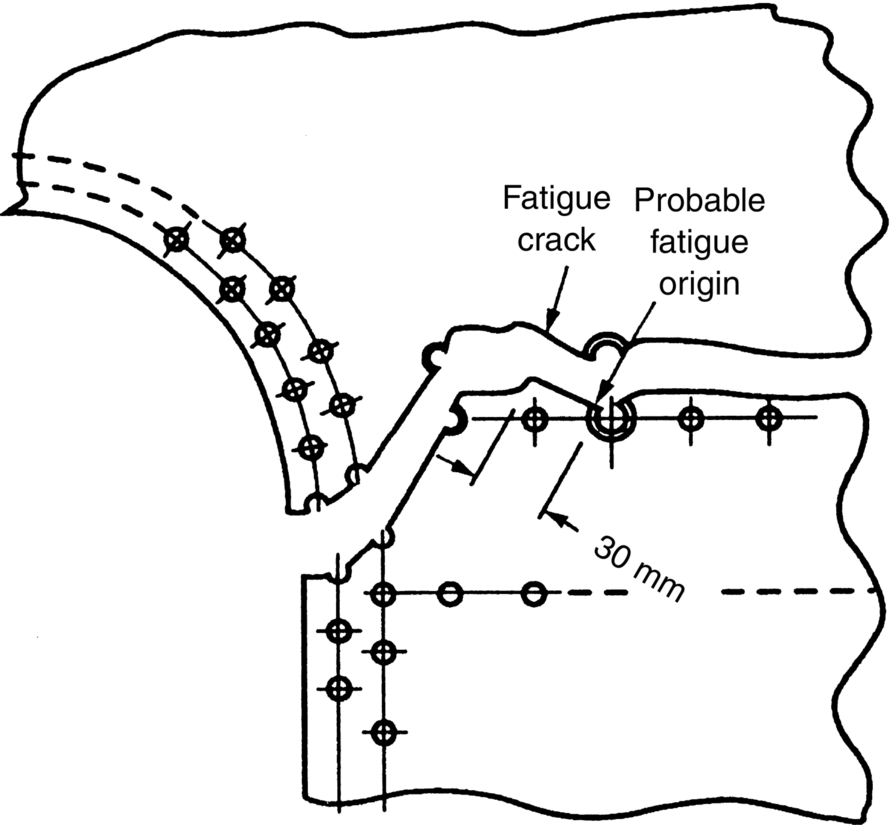
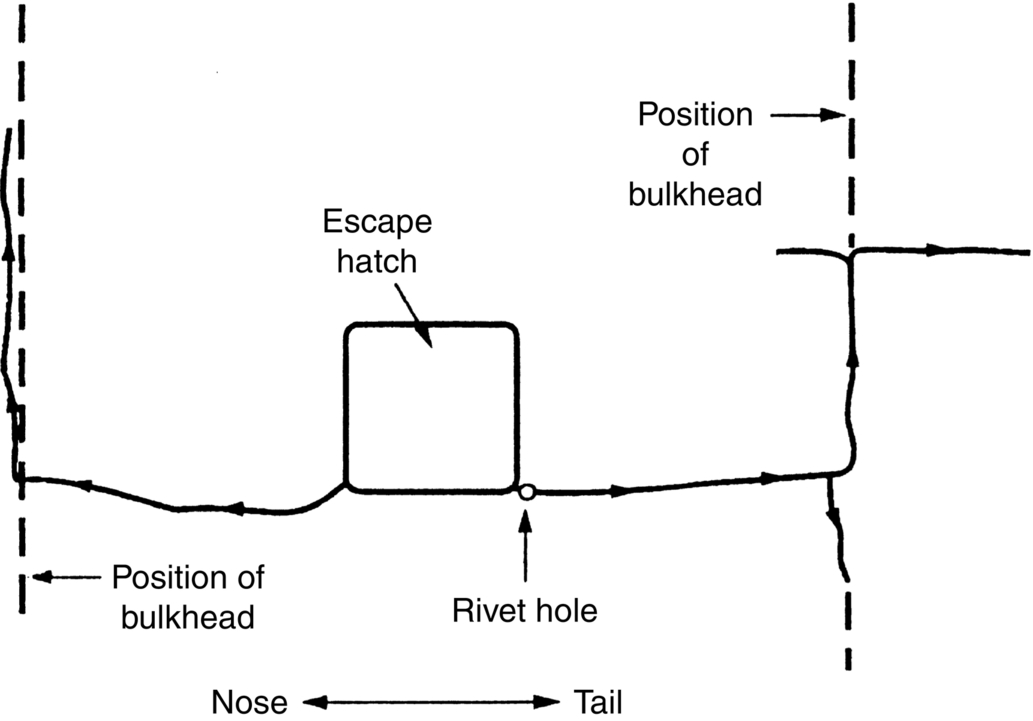
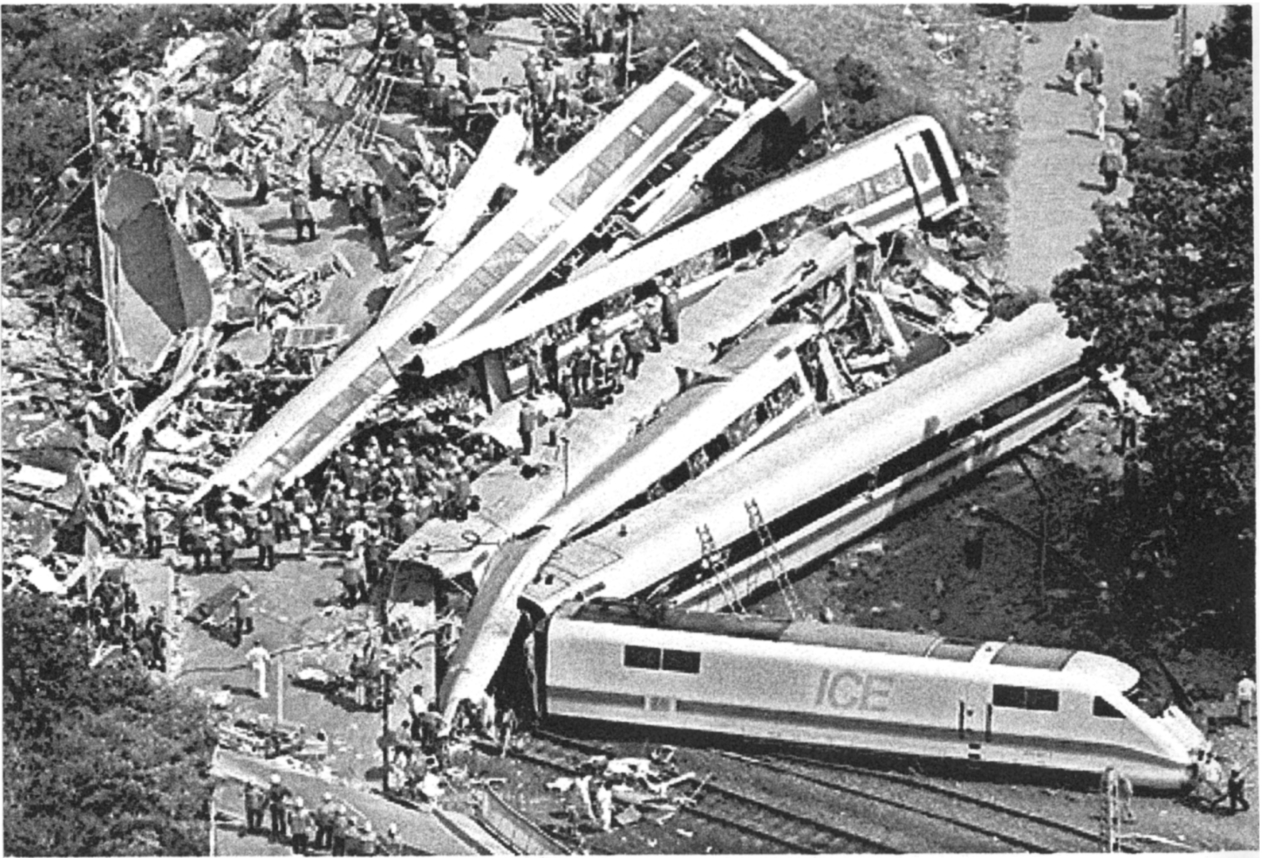
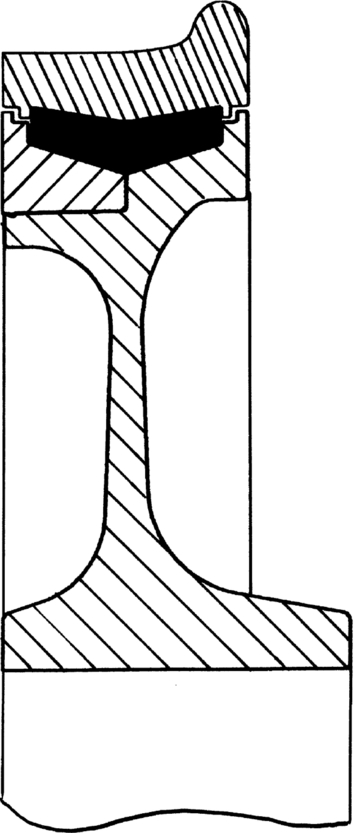
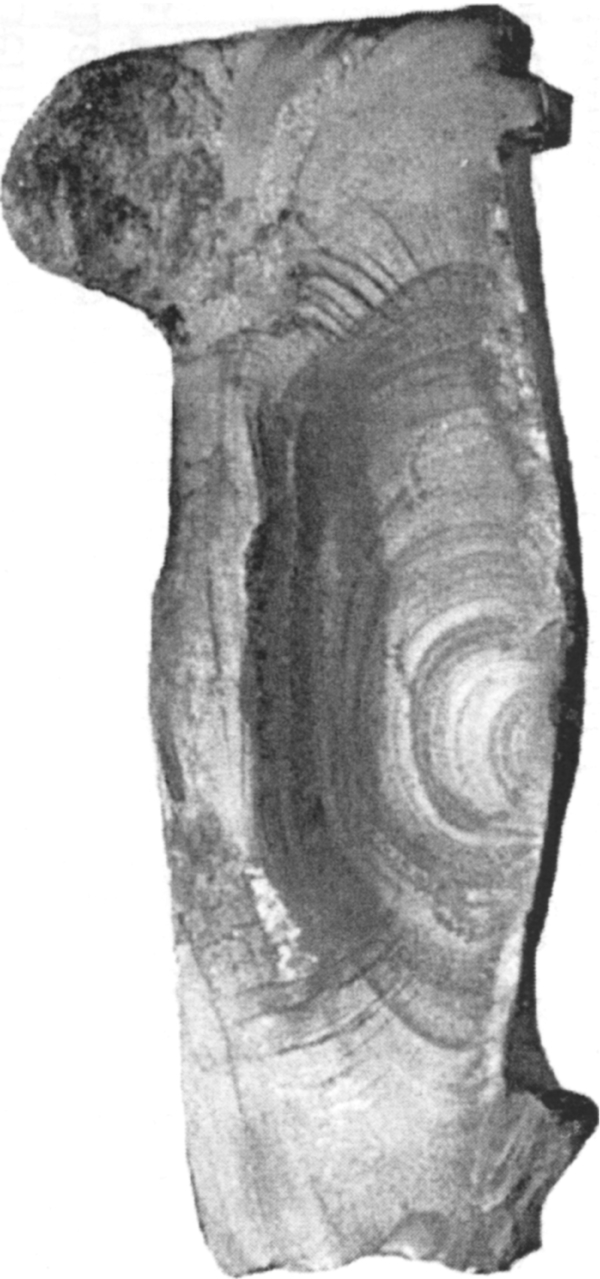
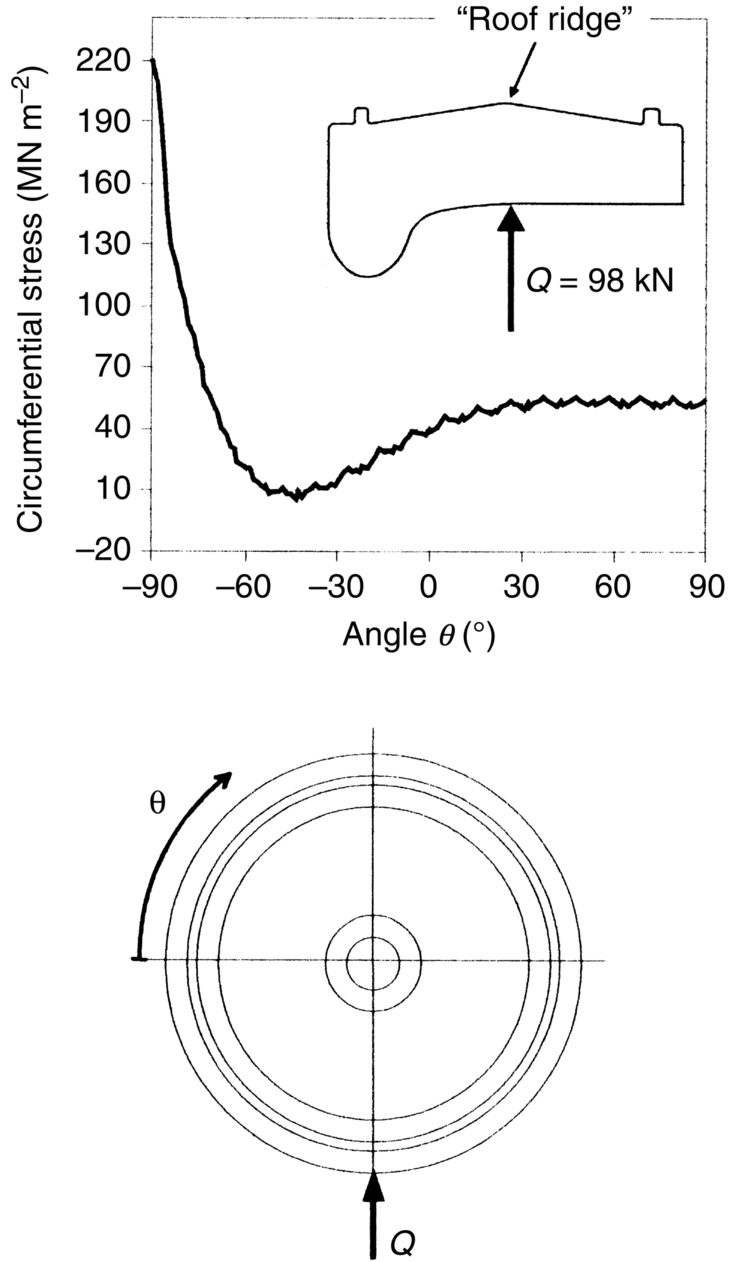
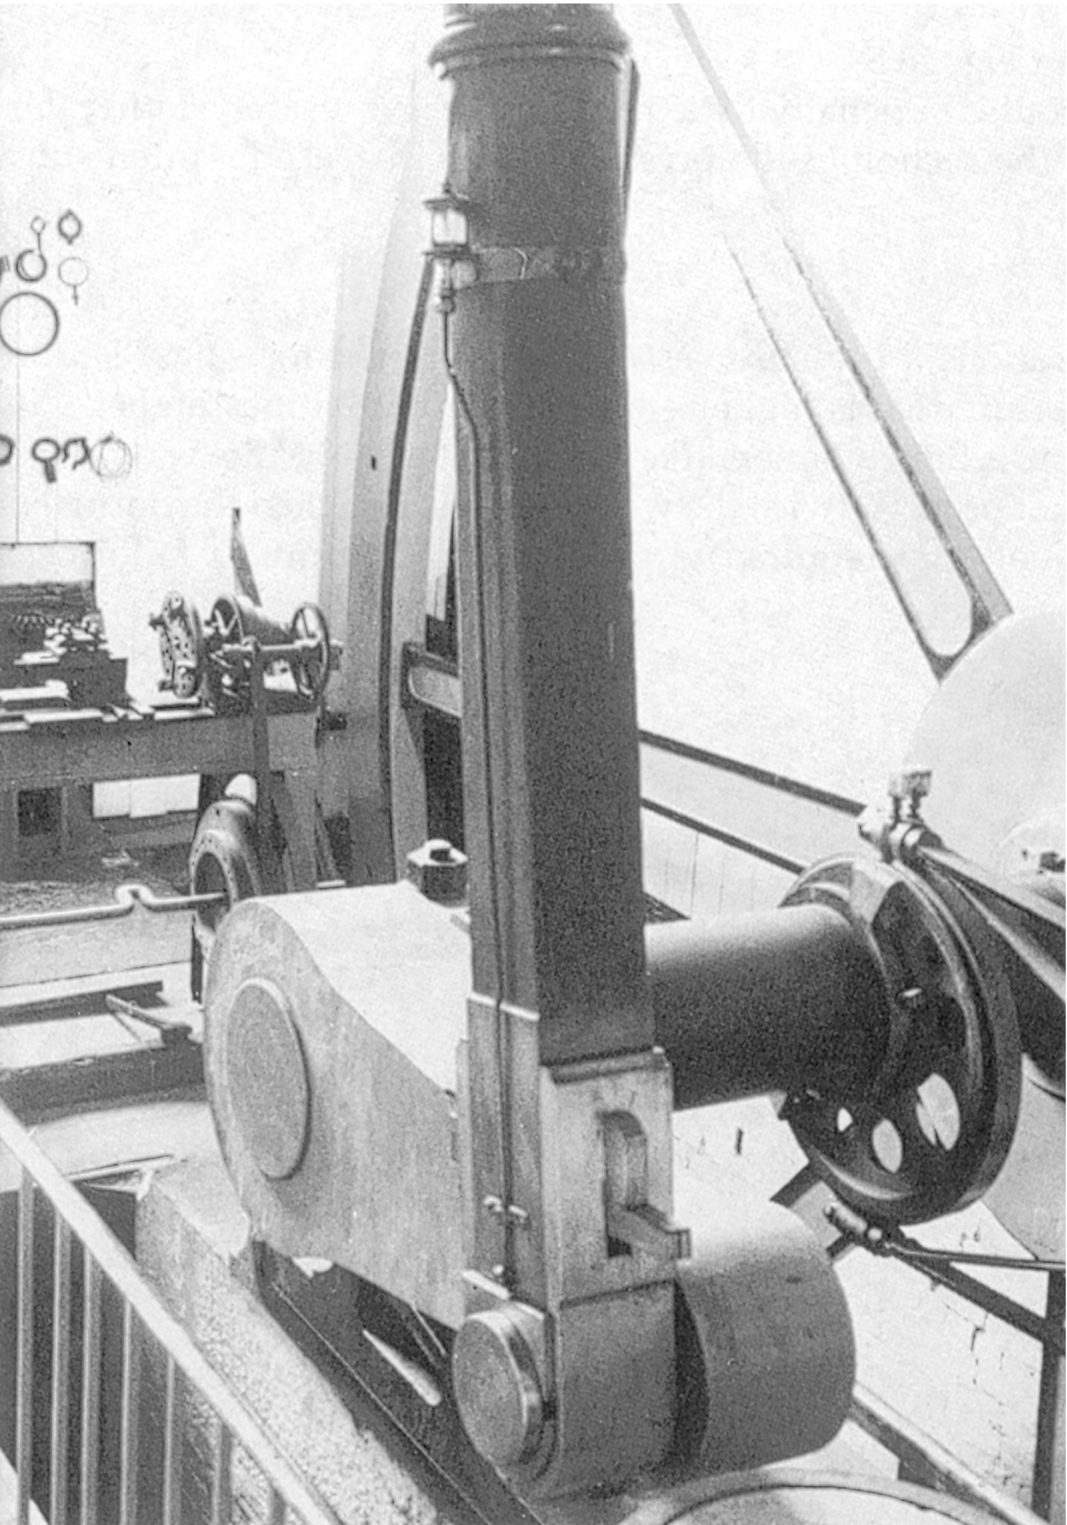
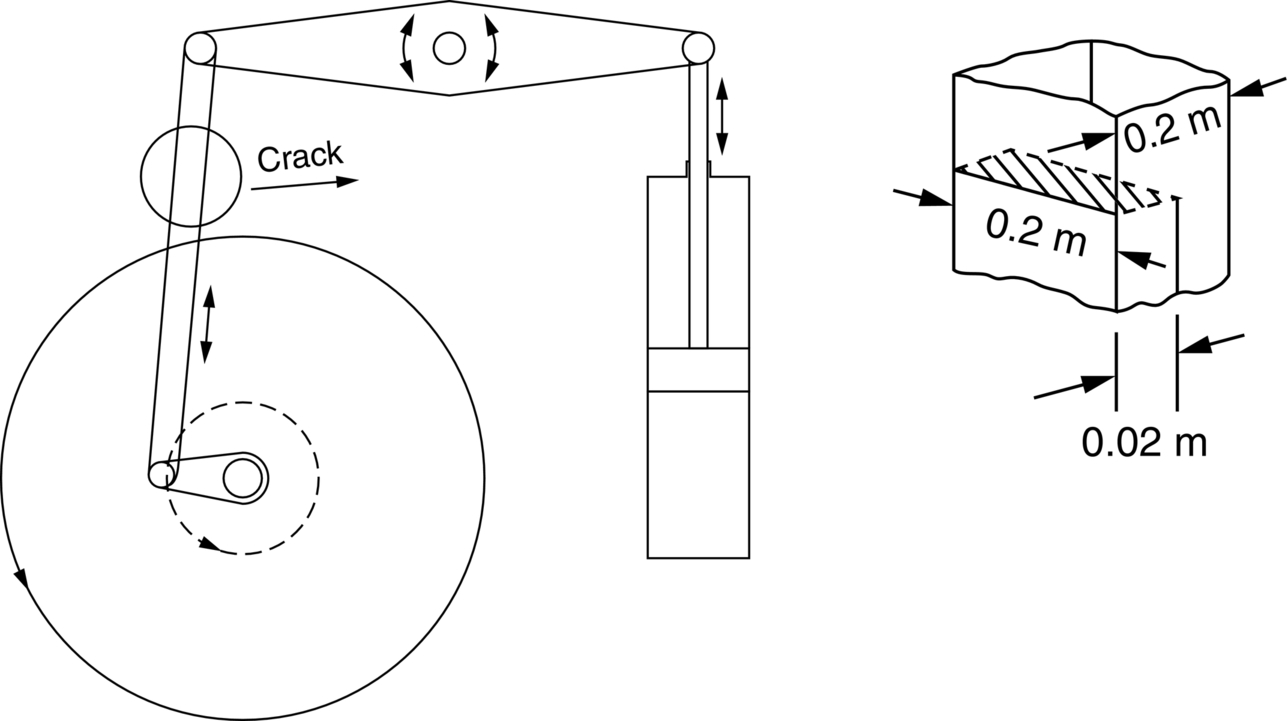
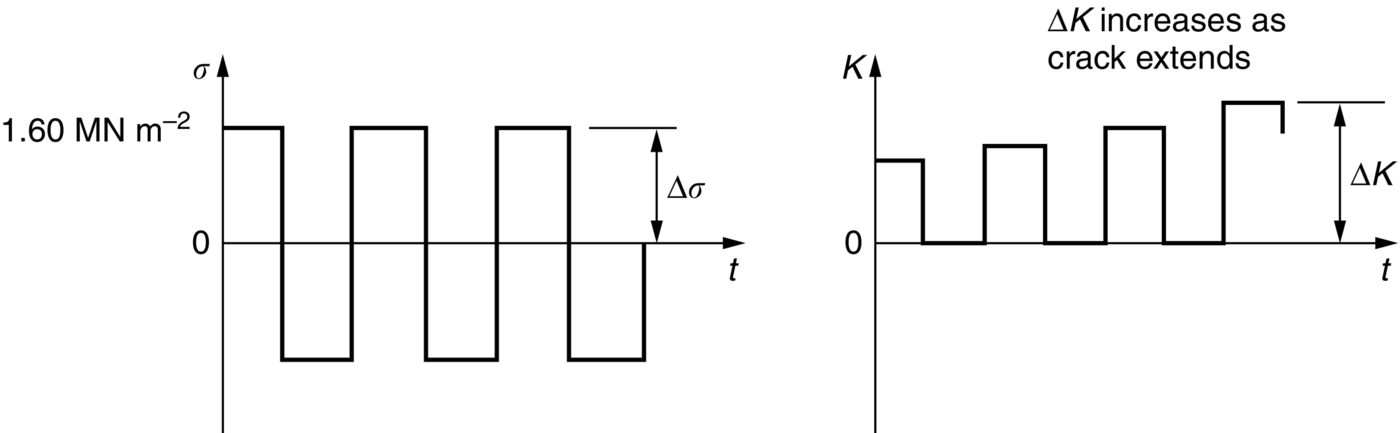
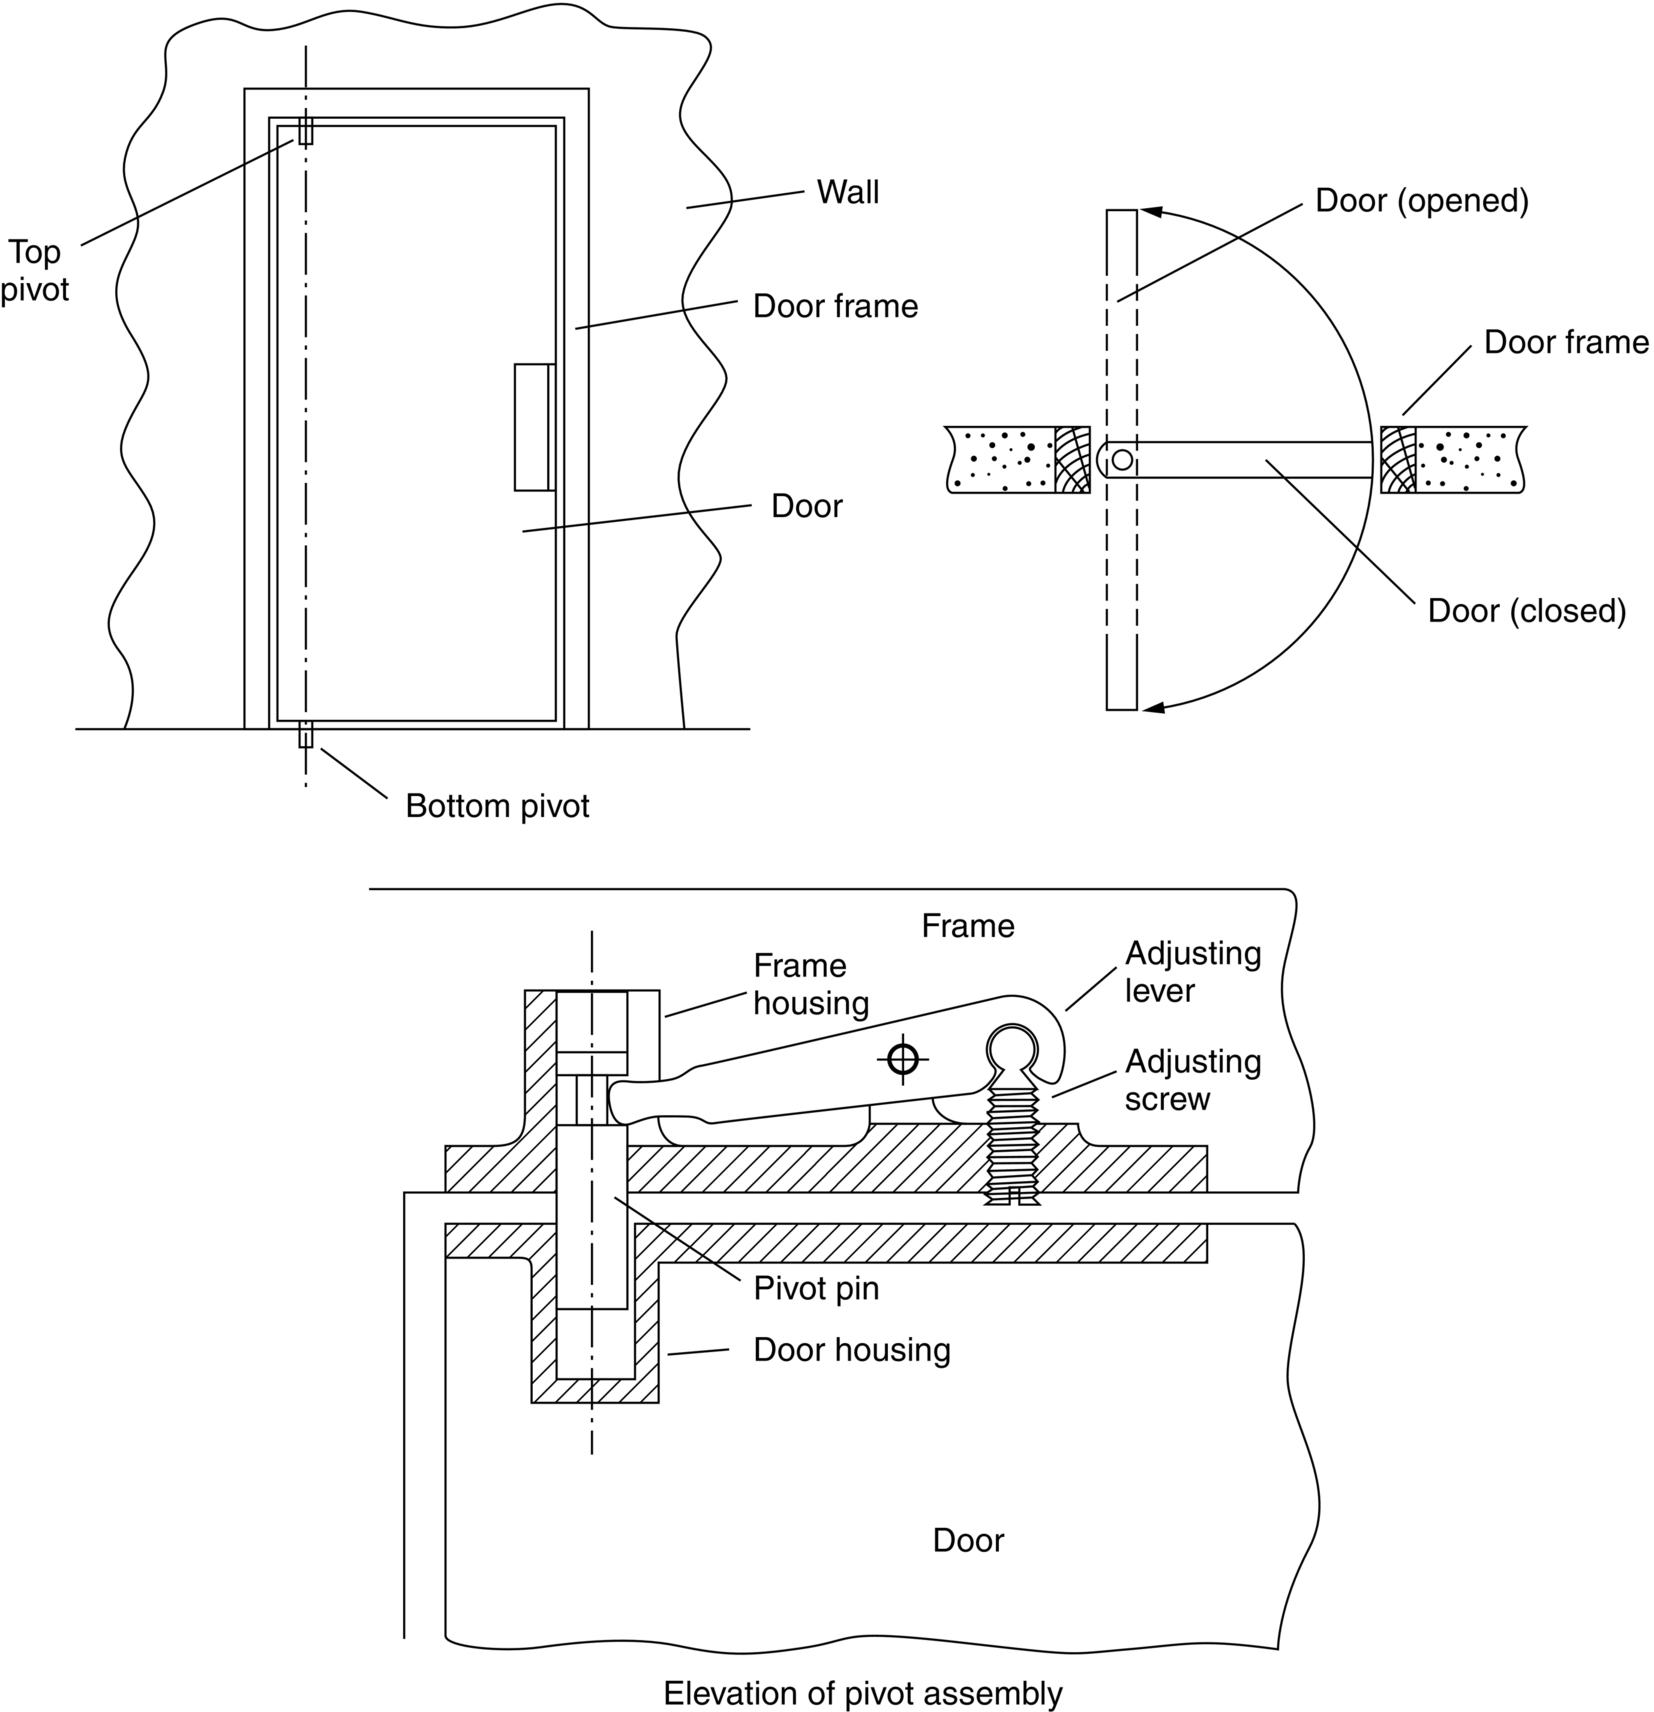
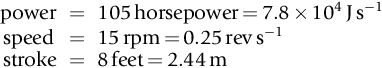
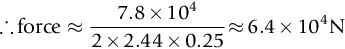
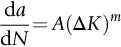
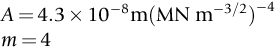
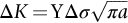
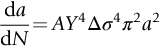
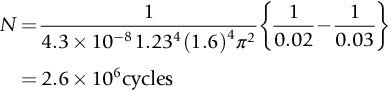
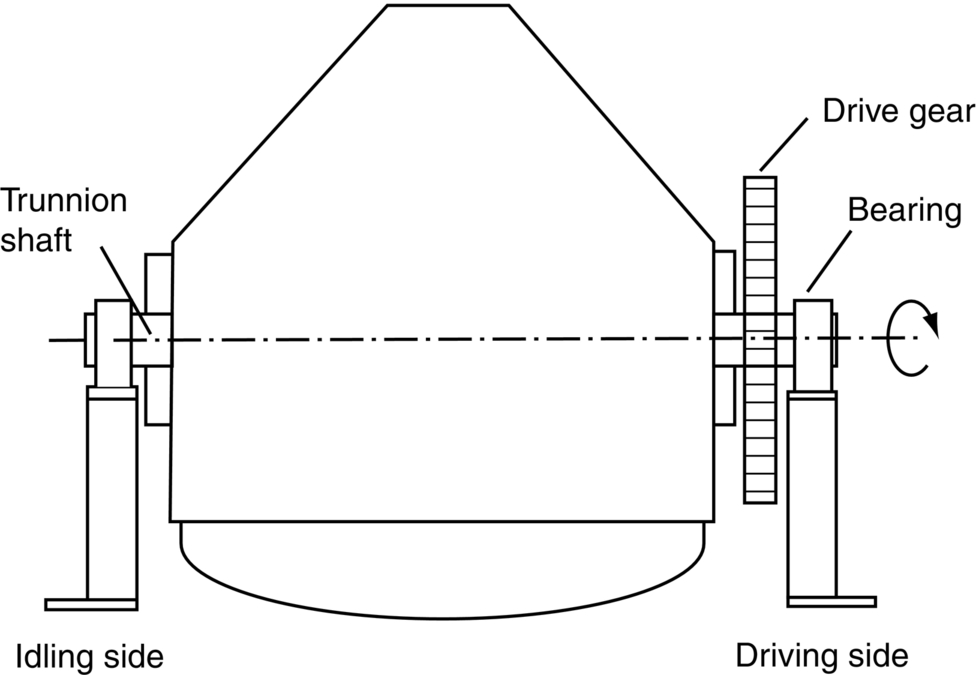
section epub:type=”chapter”> This chapter discusses three real situations where failure occurred because of fatigue. The first situation is about the crash of a Comet 1 aircraft. This aircraft was designed and built by de Havilland and put into service with BOAC in May 1952. Unfortunately, it crashed on 10 January 1954. The second case is about the Eschede railway disaster. This is about a high-speed train traveling from Munich to Hamburg (Germany) that derailed near the village of Eschede on 5 June 1998. The third case is about the safety of the Stretham engine. The Stretham steam pumping engine was built in 1831 as part of an extensive project to drain the Fens for agricultural use. Earlier, it was one of the largest beam engines in the Fens with a maximum horsepower of 105 at 15 rpm. It is now the sole surviving steam pump of its type in East Anglia. Figure 20.1 is a drawing of the Comet 1 aircraft. This aircraft was designed and built by de Havilland, and put into service with BOAC in May 1952. It was powered by four Ghost turbo-jet engines, and had a cruising altitude of 35,000 ft. It was intended for long-distance high-speed flights on passenger and freight routes with a maximum all-up weight of 49 tons. By comparison, existing civil aircraft used turbo-prop engines and had an altitude ceiling of about 17,000 ft, so the Comet was the most advanced civil aircraft of its time. Unfortunately, a disturbing crash occurred on 10 January 1954. Comet G-ALYP left Rome airport at 0931 bound for London. The crew kept in contact with control and at 0950 reported that they were over Orbetello. The flight plan indicated that the plane should have climbed to 26,000 ft. A message from the Comet was broken off at 0951 in mid-sentence. At the same time, eyewitnesses on Elba saw debris fall into the sea to the south of the island. None of the 29 passengers and six crew survived. On 8 April 1954, Comet G-ALYY left Rome at 1832 bound for Cairo. At 1857 the crew reported that they were alongside Naples, and were approaching the cruising altitude of 35,000 ft. At 1905 the crew radioed Cairo to give their estimated arrival time. This was the last transmission from the aircraft, and neither Rome nor Cairo was able to make contact again. Some light wreckage was recovered from the sea the next day. There was now mounting evidence that something was wrong with the structural integrity of the aircraft, so BOAC grounded the whole fleet. The first priority was to recover as much of the wreckage as possible. Unfortunately, G-ALYY had gone down in water 1000 m deep, and there was no realistic prospect of recovering any wreckage from such depths with the undersea technology of the time. G-ALYP had sunk in water 180 m deep, and recovery was feasible if difficult. By August 1954 the recovery team had raised 70% of the structure, 80% of the engines, and 50% of the equipment. The wreckage of the fuselage was reconstructed and the failure was traced to a crack that had started near the corner of a window in the cabin roof. The window was one of a pair that were positioned one behind the other just aft of the leading wing spar. The windows housed the antennae for the automatic direction finding (ADF) system. As Figure 20.2 shows, the crack had started near the rear starboard corner of the rear ADF window, and had then run backward along the top of the cabin parallel to the axis of the fuselage. Circumferential cracks had developed from the main longitudinal crack and as a result whole areas of the skin had peeled away from the structure. A second longitudinal crack then formed at the forward port corner of the rear window, and ran into the forward ADF window. Finally, two more cracks nucleated at the forward corners of the forward window and developed into a pair of circumferential fractures. As one might expect, the circumferential cracks all followed the line of a transverse frame member. Figure 20.3 is a close-up of the rear starboard corner of the rear window showing where the first crack probably originated. Fatigue markings were found on the fracture surface at this location: they had probably started at the edge of a countersunk hole, which had been drilled through the skin to take a fastener. Passengers cannot be carried at high altitude unless the cabin is pressurized. The Comet cabin was pressurized in service to 0.57 bar gauge, 50% more than the pressure in other civil aircraft at the time. During flight, the fuselage functions as a pressure vessel, and is subjected both to an axial and a circumferential tensile stress as a result. With each flight the fuselage experiences a single cycle of pressure loading. Comets G-ALYP and G-ALYY had flown 1290 and 900 flights respectively. The conclusion was that this small number of cycles had generated a fatigue crack, which in time had become long enough to cause fast fracture. The skin of the fuselage was made from aluminum alloy sheet, with yield and tensile strengths of approximately 350 and 450 MN m-2. Approximate hand calculations by de Havilland (at normal cabin pressure) gave an average stress of about 195 MN m-2 near the corner of a typical window. The rules of the International Civil Aviation Organisation (ICAO) contained two major requirements for pressurized cabins: there was to be no deformation of the structure when the cabin was pressurized to 33% above normal; and the maximum stress in the structure at a pressure 100% above normal was to be less than the tensile strength. De Havilland decided to go one better—it increased the “design” pressure from 100 to 150% above normal, and decided to pressure test a section of the fuselage to 100% above normal. At this test pressure, the maximum stress near the windows should have gone up to 390 MN m-2 if the stress calculations were to be believed. This was still less than the tensile strength, and de Havilland was sure that the cabin would stand up to this increased test pressure without excessive deformation. In the event, the test section withstood two pressure tests to 100% above normal without any problems, showing that there was an ample margin of safety on static pressure loading. The ICAO rules did not consider the possibility of fatigue caused by repeated cycles of pressure loading. But there was a growing awareness that this was a potential problem. As a result, de Havilland decided to determine the likely fatigue life of the fuselage. Between July and September 1953 (more than a year after the aircraft had entered service!), the test section was subjected to a continuous fatigue test, which involved cycling the pressure between zero and the normal operating value. After 18,000 cycles, the section failed from a fatigue crack, which had initiated at a small defect in the skin next to the corner of a window. The design life of the Comet was 10,000 flights, so de Havilland considered that it had demonstrated a reasonable margin of safety against fatigue from pressure cycling. The air accident investigators decided to do a full-scale simulation test on a Comet aircraft, in order to confirm that the failure had indeed been caused by fatigue from repeated cycles of cabin pressure. The aircraft chosen was G-ALYU, which had already made 1230 flights. The aim was to cycle the cabin pressure between zero and the normal operating value until it failed by fast fracture. This could not be done using air, because the energy released when the cabin broke up would be equivalent to a 225 kg bomb. It was decided instead to pressurize the cabin using water. In order to balance the weight of water in the cabin the whole of the fuselage was put into a large tank and immersed in water at atmospheric pressure. Finally, the required pressure differential was generated by pumping a small volume of water into the fuselage. The cabin failed after 1830 cycles in the tank, giving a total of 1230 + 1830 = 3060 “flights.” The crack started at an escape hatch, which was positioned in the port side of the cabin just forward of the wing. As shown in Figure 20.4, the fatigue crack initiated at the bottom corner of the hatch. Once the crack had reached the critical length it ran backward along the axis of the fuselage. The crack was diverted in a circumferential direction at the site of a transverse bulkhead. A second crack then nucleated at the forward bottom corner of the hatch. This crack ran forward along the axis of the fuselage until it was diverted into a circumferential crack at another transverse bulkhead. The panel of skin detached by the cracks was pushed out of the fuselage by a few centimetres, relieving the pressure inside the cabin and arresting the failure process. If the cabin had been filled with air, the panel would have blown right out, and the whole fuselage would have exploded. The fuselage was repaired and strain gauges were stuck on to the skin immediately next to the edge of a window. The cabin was taken up to normal operating pressure and the stresses were found from the strain gauge readings. The maximum stress appeared at the corner of the window, and had a value of 297 MN m-2. The background stress at the location of the critical bolt hole would obviously have been much less, since it was located some distance away from the edge of the window. However, the bolt hole would have acted as a stress raiser, and this could have increased the local stress by as much as a factor of 3 above the background stress. The designers should have been aware that introducing bolt holes near the windows was bound to lead to high local stresses, and that under repeated cycles of cabin pressurization these bolt holes were likely to be preferential sites for fatigue crack initiation. In addition, the investigators were able to point to two crucial fallacies in the de Havilland figure for the fatigue life. The first was purely statistical. Data for low-cycle fatigue were already known to show a large amount of scatter. The probability that a single Comet would fail by fatigue could only be found if both the mean and the standard deviation of the test data were known. This information could not have been obtained from one solitary fatigue test. The second was that the test section had been pressurized to 100% above normal before the fatigue test, whereas the production aircraft themselves had only been proof tested to 33% above normal. When the test section was taken to 100% above normal, the bolt holes could have yielded in tension. In this case, when the structure was let down to atmosphere again, the elastic spring-back would have put the holes into compression. When, later on, the test section was taken up to normal operating pressure during the fatigue test, the metal around the holes would have experienced a reduced tensile stress and consequently an increased fatigue life. The final irony is that the doublers and other stiffeners around the window openings were not meant to be attached to the skin with bolts and rivets at all, but instead with glued joints. However, the design was revised at a late stage because it was felt that it would be difficult and expensive to make glued joints in these geometrically complex locations (although glued joints were extensively used elsewhere in the airframe—yet another pioneering innovation, and one much used in modern aircraft). In conclusion, although the enquiry established the technical reasons for the failures, in reality the most important factors were probably that de Havilland tried to introduce too many innovations at once, and as a medium-sized company overstretched its design department. It is no surprise that civil aircraft construction today is dominated by huge companies or consortia (most notably Boeing in the United States and Airbus in Europe) because of the sheer range and complexity of design, manufacturing, and maintenance capability needed to support modern civil aircraft fleets. Even so, air crashes caused by the failure of structures or components continue to occur (although nowadays many are due to faulty maintenance procedures rather than design errors, and the numbers are much smaller in relation to the size of aircraft fleets than they used to be). On 5 June 1998, a high-speed train traveling from Munich to Hamburg (Germany) derailed near the village of Eschede (see Figure 20.5). The speed of the train was approximately 250 km h-1. The train consisted of two power cars (one at each end) plus 12 carriages. The steel tire of one of the wheels suffered a fatigue fracture, came away from the wheel, and jammed under the floor of the carriage. The broken tire then became stuck in a set of points (or switch), and switched them from the running line to the junction line. The broken tire came from the rear bogie of the leading carriage, so although the front power car was still on the running line, the rear of the leading carriage was diverted on to the junction line, and it and the remainder of the train were derailed as a result. By a very rare coincidence, the derailment occurred just before an over-bridge. The derailed part of the train (still traveling at high speed) demolished one of the supporting piers of the bridge, which promptly collapsed on to the train. This led to the almost total destruction of much of the train. One hundred people were killed in the crash, and more than 100 injured. Criminal proceedings for negligent homicide were commenced against the operators of the railway and the manufacturer of the wheel. The subsequent technical investigations involved a total of 13 experts from five different countries. Of the 112 wheels in the train, 36 were of the monobloc type (consisting of a one-piece steel wheel with an integral tire). However, the remaining 76 were rubber-sprung wheels (see Figure 20.6) in which rubber blocks were fitted between the tire and the wheel center to help damp out the vibrations generated by wheel–rail contact. This type of wheel had been introduced into the high-speed trains in Germany in 1991, although similar wheels had been used successfully in commuter trains and trams for some time previously. The fracture surface of the broken tire is shown in Figure 20.7. It has classic fatigue beach marks, which show that the fatigue crack initiated at the bore of the tire near the position of maximum thickness. The area proportion of final fast fracture is small, indicating a relatively low maximum stress. The stress geometry is shown in Figure 20.8. The most important load on the wheel is the vertical load Q at the wheel–rail interface. This is produced by the deadweight of the carriage (78 kN per wheel) plus a multiplier of 1.25 to allow for average dynamic loads, giving a total design load of 98 kN. Looking at Figure 20.8, one can see that because the tire is supported on a relatively soft rubber foundation, it will deflect above the loading point, and this will generate a tensile stress at the bore of the tire. The effect of this deflection is felt all around the circumference of the tire. The stress is a maximum above the loading point, as would be expected, and has a value of 220 MN m-2. However, moving around the circumference away from the loading point, the stress falls off rapidly, reaching a minimum of 6 MN m-2 after an angular rotation of 45°. Moving around to the top of the wheel, the stress increases again (but to a maximum of only 55 MN m-2). The bore of the tire is thus subjected to one complete fatigue cycle with each revolution of the wheel, with stress amplitude 107 MN m-2 and mean stress 113 MN m-2. However, there are two equal stress troughs per cycle, and two unequal stress peaks per cycle. It should be noted that the rubber blocks did not fill all the space between the tire and the wheel center. Each wheel was fitted with a total of 34 rubber blocks, which were equally spaced around the circumference of the wheel center, with circumferential gaps between them. Had there not been adequate circumferential gaps between the blocks, they would not have been able to expand circumferentially when compressed by the radial load Q (they were not able to expand axially because they were a close fit to the width of the channel in the wheel center). Because Poisson’s ratio for rubber is 0.5, it must be allowed to expand sideways in at least one principal direction if it is to be “springy.” If sideways expansion were prevented in both principal directions, the block would behave as a very stiff structure indeed, and be useless as a damper (see Example 7.14). The stress plot in Figure 20.8 was generated using an immensely complex finite-element model. A full three-dimensional model was generated, the elastic behavior of the rubber was modeled with a nonlinear constitutive equation, and the frictional contact between the rubber block and the steel was modeled with a nonlinear frictional law. Such an analysis had never been done at the design stage, which is not surprising given the rapid advances in finite-element modeling and computing power in recent years. Interestingly, the model was so good that the gaps between adjacent rubber blocks gave rise to a periodic “wobble” in the stress plot. Turning to the fatigue strength of the tire, tests on the steel gave a tensile strength of 828 MN m-2, so as a first approximation one would expect a fatigue strength for a long life of approximately 40% of this figure (i.e., 330 MN m-2 stress amplitude). However, when designing the actual wheel, the fatigue strength was reduced to 200 MN m-2 stress amplitude. This was to allow for the effect of the tensile mean stress and also to have a safety factor. According to the published data, therefore, the tire should not have failed—because the stress amplitude in service (107 MN m-2) should only have been half the fatigue strength of the tire with safety factor included. The experts could not agree on the cause for the failure, and as a result, the criminal proceedings were dropped. The tires of railway wheels wear as a result of contact with the running rails, and as a result they need to be reprofiled regularly. To do this, the wheel-set is removed from the bogie, and the outer circumference of the tire is turned in a lathe to give the correct profile again. Over time, repeated reprofiling reduces the outer diameter of the tire, and the failed tire (diameter 860 mm) had nearly reached the diameter for scrapping. New tires had an outer diameter of 920 mm. After the accident, the lower limit on diameter was increased to 880 mm. Obviously, the larger the diameter, the thicker the tire, and the lower the fatigue stress for a given applied loading. The disaster raises a number of interesting issues. The first is that a fatigue failure did occur, and therefore there must be an explanation. The implication is that the investigators must have missed something. This is not to be in any way critical of them. The standard of proof required in a criminal case is to prove beyond all reasonable doubt that the defendants were grossly negligent, which is a much more limited brief than the technical investigation required to ensure the future safety of a fleet of trains. Some technical issues that come to mind are: (a) what was the actual service load spectrum (as distinct from that assumed in the design); (b) was there any fretting between the rubber blocks and the tire; (c) did the rubber blocks “creep” around the circumference of the wheel with service time, resulting in inadequate support? Finally, when an innovative design of wheel brings with it such serious technical difficulties, is it any wonder that the railway industry is so conservative? The Stretham steam pumping engine (Figure 20.9) was built in 1831 as part of an extensive project to drain the Fens for agricultural use. In its day it was one of the largest beam engines in the Fens, having a maximum horsepower of 105 at 15 rpm (it could lift 30 tons of water per revolution, or 450 tons per minute); it is now the sole surviving steam pump of its type in East Anglia.⁎ The engine could still be run for demonstration purposes. Suppose that you are called in to assess its safety. We will suppose that a crack 0.02 m deep has been found in the connecting rod—a cast-iron rod, 21 feet long, with a section of 0.04 m2. Will the crack grow under the cyclic loads to which the connecting rod is subjected? And what is the likely life of the structure? The stress in the crank shaft is calculated approximately from the power and speed as follows. Bear in mind that approximate calculations of this sort may be in error by up to a factor of 2—but this makes no difference to the conclusions reached below. Referring to Figure 20.10: Force × 2 × stroke × speed ≈ power Nominal stress in the connecting rod = F/A = 6.4 × 10⁴/0.04 = 1.6 MN m–2 approximately. For cast iron, Kc = 10 MN m–3/2. First, could the rod fail by fast fracture? The stress intensity is: It is so much less than Kc that there is no risk of fast fracture, even at peak load. The growth of a fatigue crack is described by For cast iron, We have that where Δσ is the range of the tensile stress (Figure 20.11). Although Δσ is constant (at constant power and speed), ΔK increases as the crack grows. Substituting in Equation (20.1) gives and Integration gives the number of cycles to grow the crack from a1 to a2: for a range of a small enough that the crack geometry does not change appreciably. Let us work out how long it would take our crack to grow from 0.02 to 0.03 m. The average value of Y over this interval is 1.23. This is sufficient for the engine to run for 8 h on each of 360 open days for demonstration purposes; that is, to give 8 hours of demonstration each weekend for 7 years. A crack of 0.03 m length is still far too small to go critical, and thus the engine will be perfectly safe after the 2.6 × 10⁶ cycles. Under demonstration the power delivered will be far less than the full 105 horsepower, and because of the Δσ4 dependence of N, the number of cycles required to make the crack grow to 0.03 m might be as much as 1000 times the one we have calculated. The estimation of the total lifetime of the structure is more complex—substantial crack growth will make the crack geometry change significantly; this will have to be allowed for in the calculations by treating Y as a variable in the integration. After 5 years in service (equivalent to 5 × 10⁶ revolutions), fatigue cracks started to appear, and the vessel had to be taken out of service. Where do you think the fatigue cracks were located? Explain your answer.
Case Studies in Fatigue Failure
Publisher Summary
20.1 Case Study 1: The Comet Air Disasters
20.2 Case Study 2: The Eschede Railway Disaster
20.3 Case Study 3: Safety of the Stretham Engine
Mechanics
Failure by fast fracture
Failure by fatigue
Examples
[In answering these questions, please note the following information: the pivot pin was a very loose fit in both the door housing and the frame housing; the pivot pin tended not to rotate in the frame housing—instead, the door housing tended to rotate about the pivot pin.]
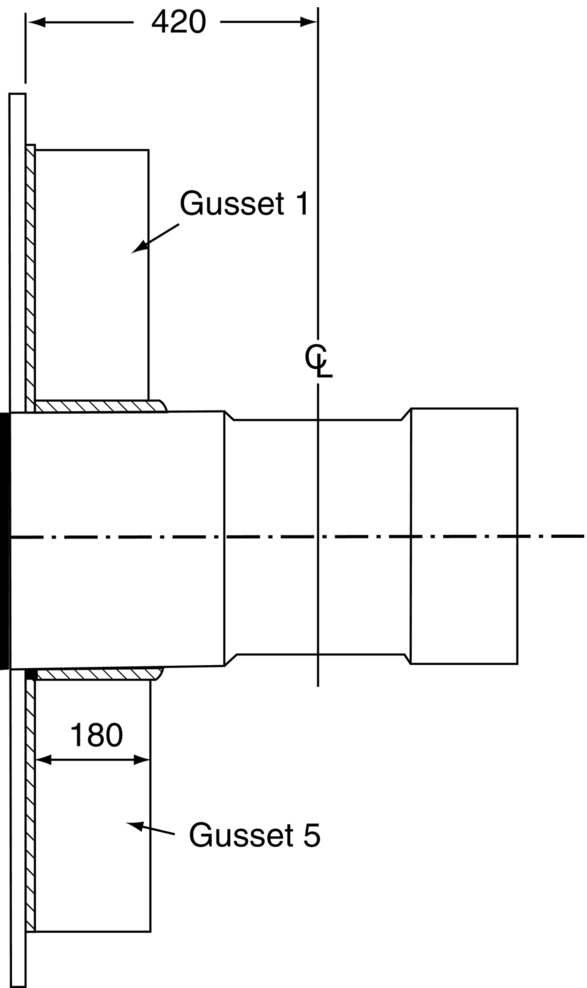
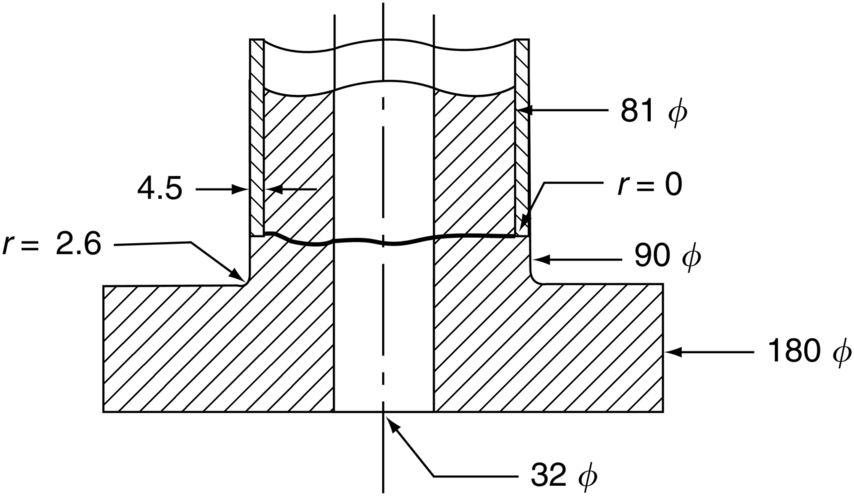
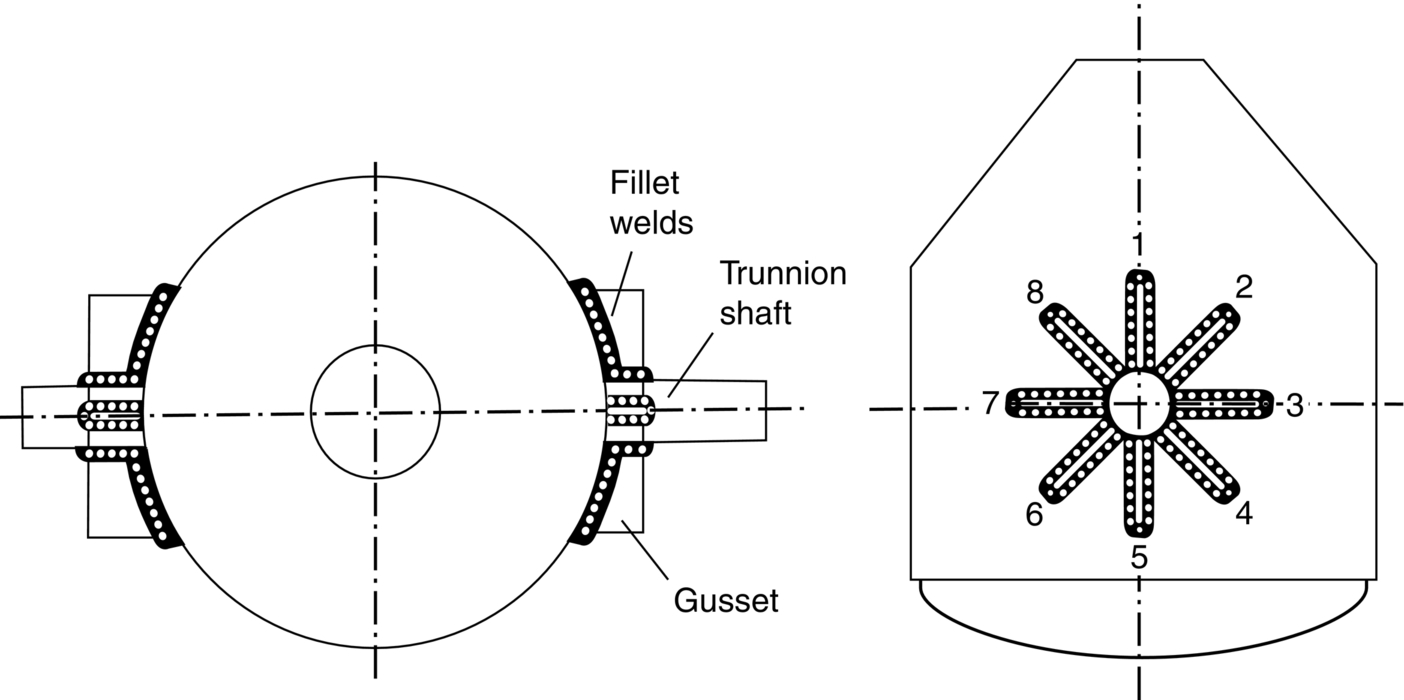
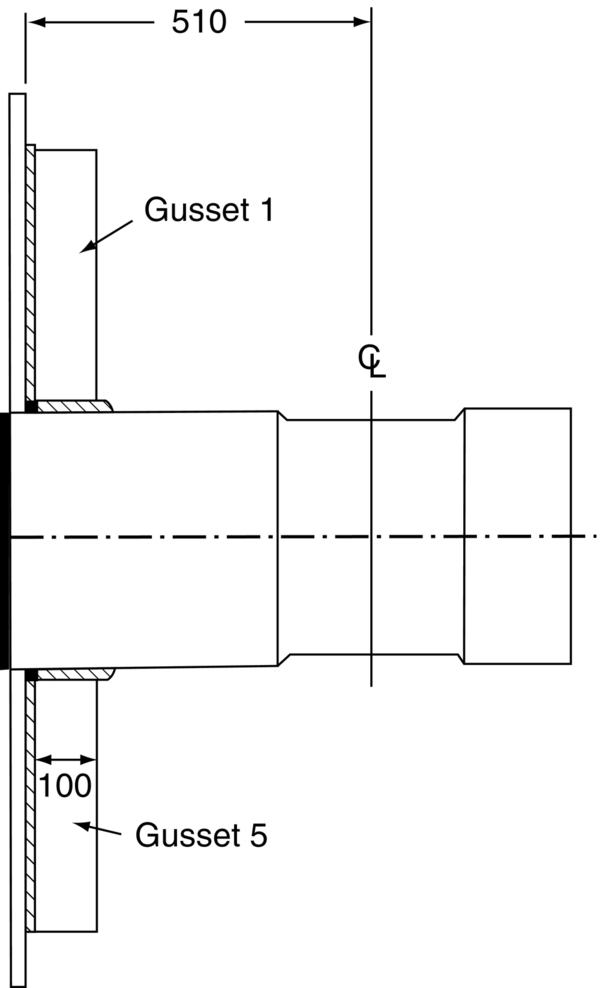
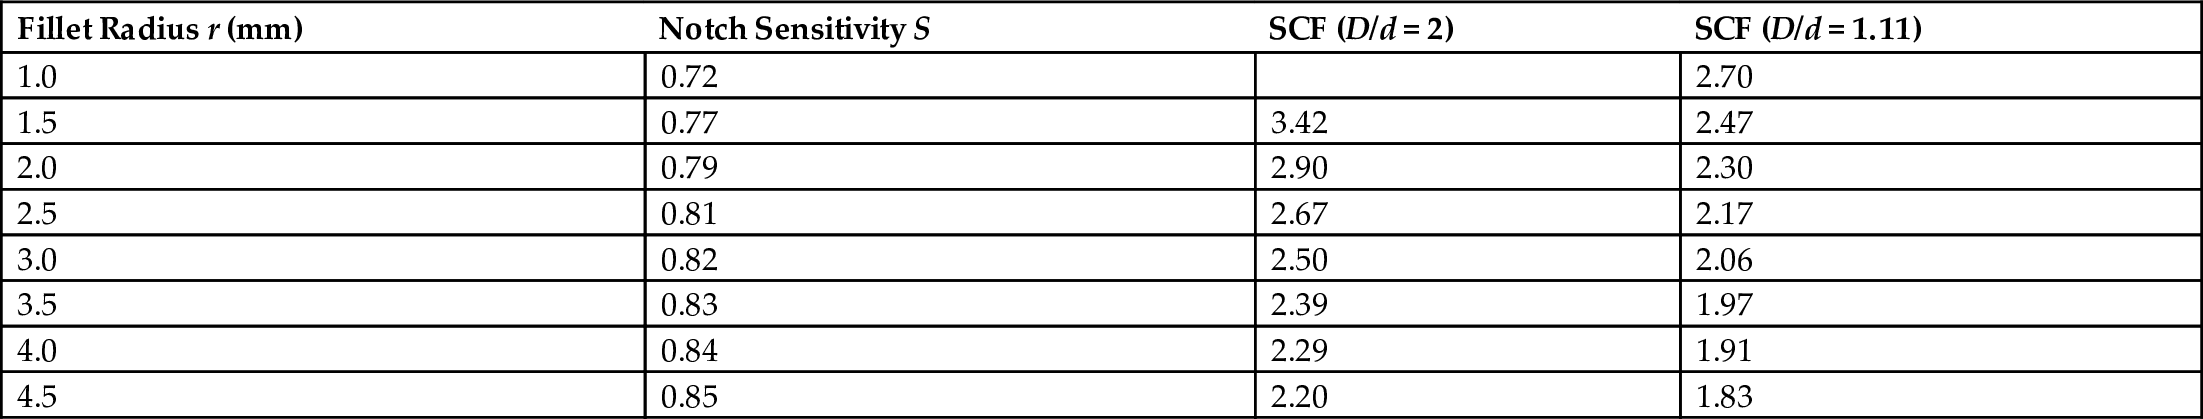
After about 8 months in service, equivalent to 10 million revolutions, the shaft failed from a fatigue crack shown in the diagram. Although there was no information on the fatigue loading produced by the stirrer, it was necessary to return the vessel to service as soon as possible. Dye-penetrant inspection of the 2.6 mm fillet showed no fatigue cracking, even though the surface had obvious circumferential lathe turning marks which would have reduced the fatigue strength. Estimate the radius of fillet which would be required at the location of the fracture to prevent a recurrence of fatigue failure. Data are given in the following table.
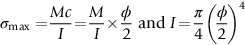
The maximum bending stress in the shaft is given approximately by
where B is a constant, and ϕ (the outer diameter of the cross section) is either 90 mm or 81 mm. You may assume that the fatigue strength of the steel levels out above 10 million cycles.
Which other methods could you use to increase the resistance of the fillet to fatigue cracking in order to compensate for the required reduction in fillet radius?
 .
.
Answers
Then, 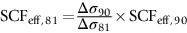 .
.
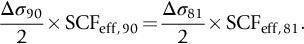
The maximum bending stress ratio is 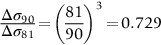 .
.
Equation (19.1) gives SCFeff = S(SCF – 1) + 1. The look-up table can be used to find values of S, and SCF corresponding to the two steps in diameter, for a range of fillet radii. For the 2.6-mm fillet at the 180/90 step, SCFeff,90 = 2.33. Then, SCFeff,81 = 0.729 × 2.33 = 1.70.
We now need to use the look-up table to reverse engineer the fillet radius at the 90/81 step, which gives an SCFeff of 1.70. The required radius is 4.5 mm.
 give the required result.
 , i.e., at the surface of the thickest part of the cross section.


⁎ Until a few of centuries ago much of the eastern part of England which is now called East Anglia was a vast area of marshes, or fens, which stretched from the North Sea as far inland as Cambridge.