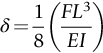
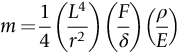
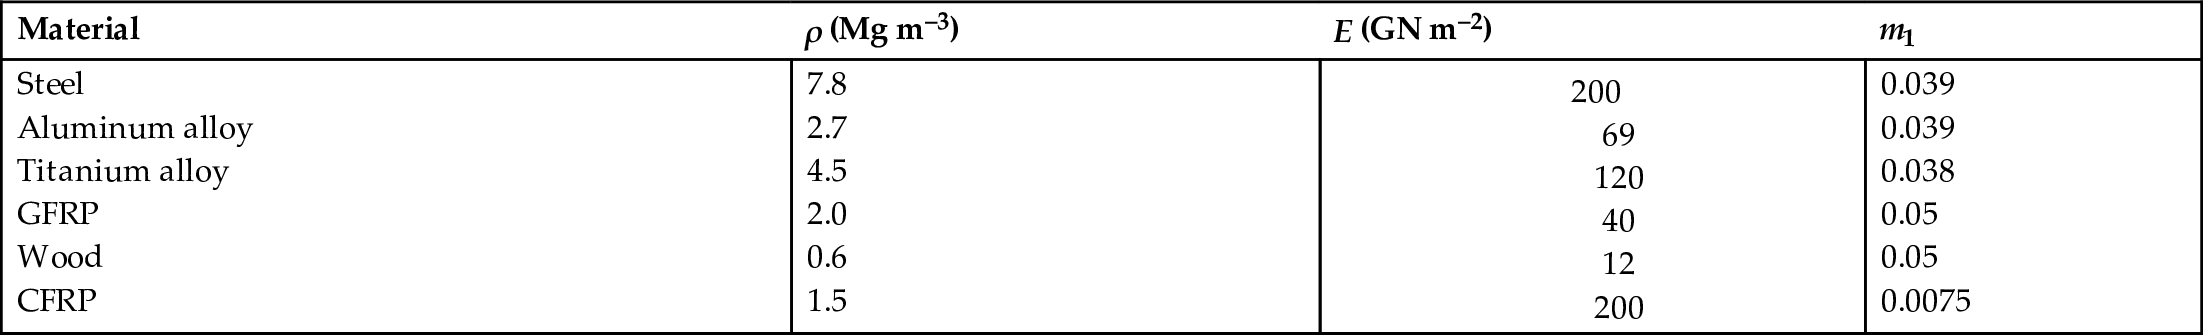
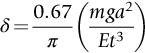
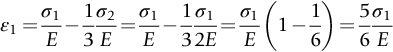
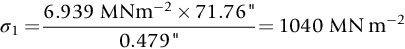
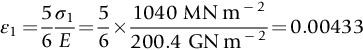
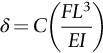
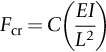
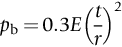
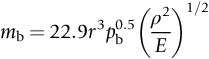
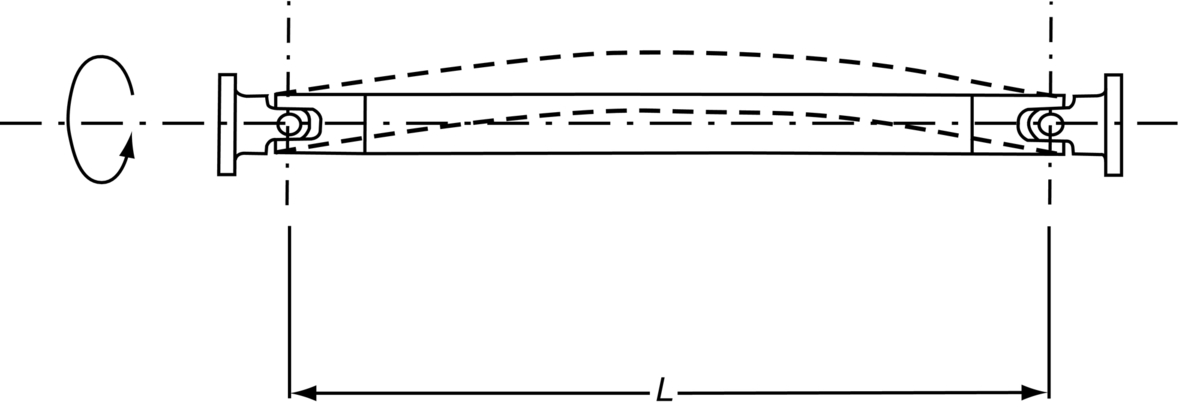
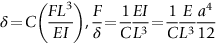
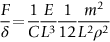
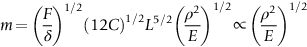
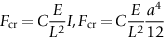
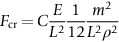
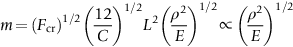
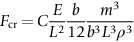
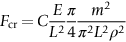
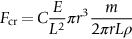
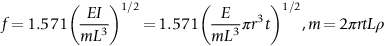
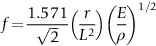
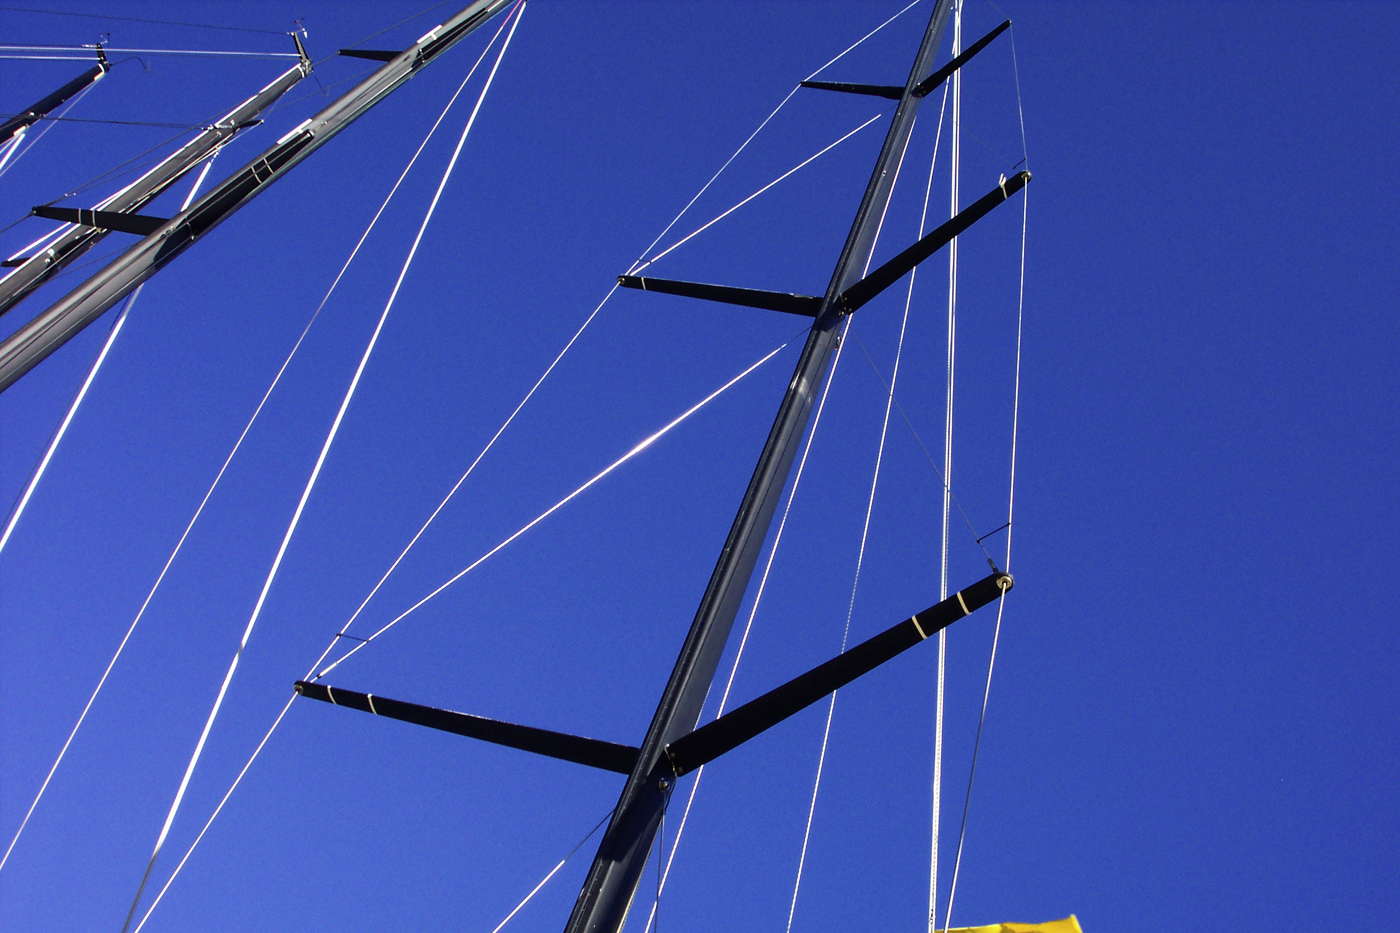
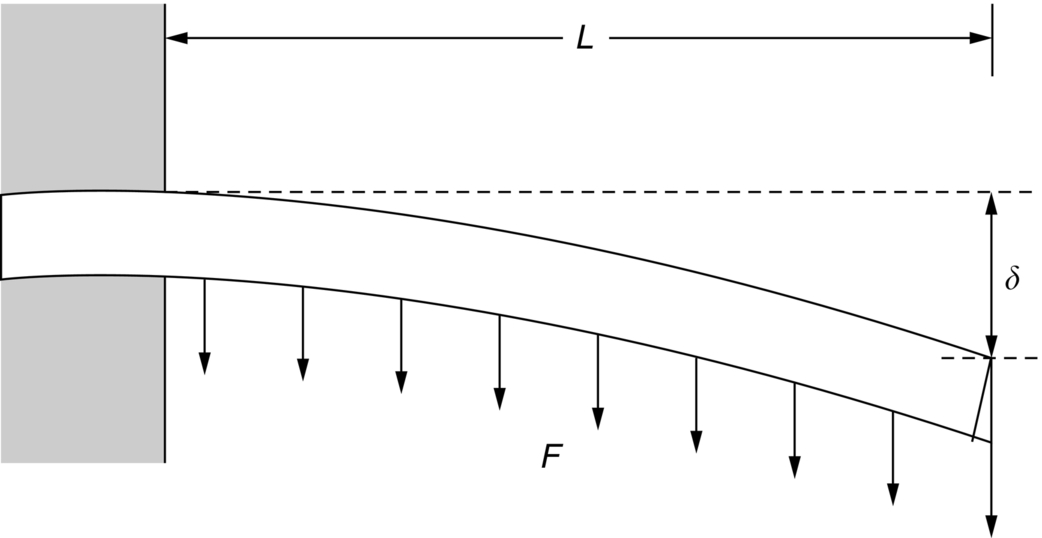
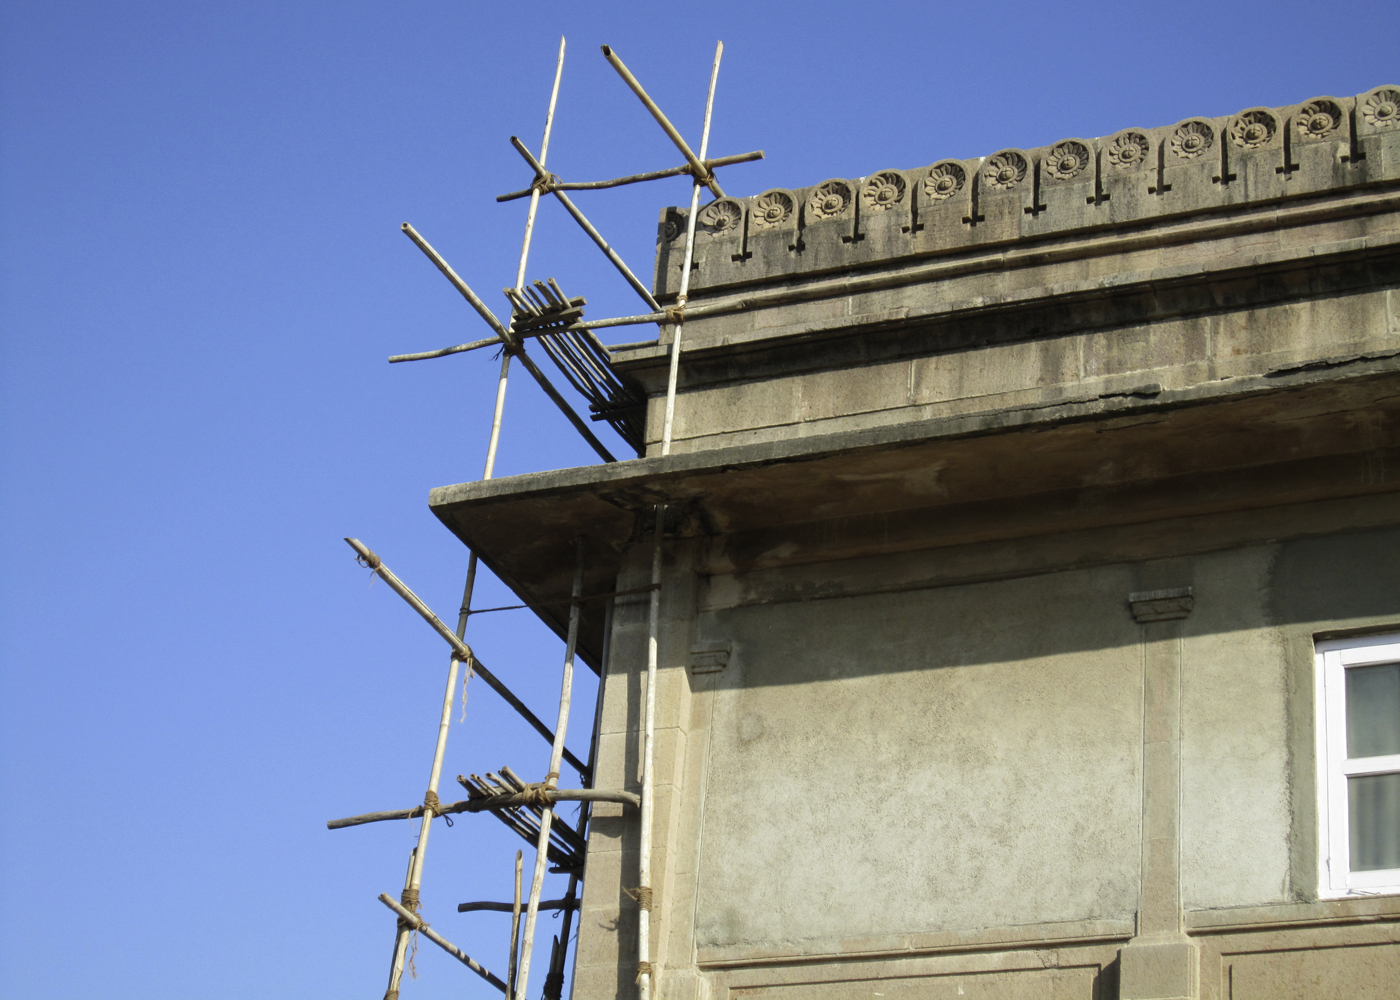
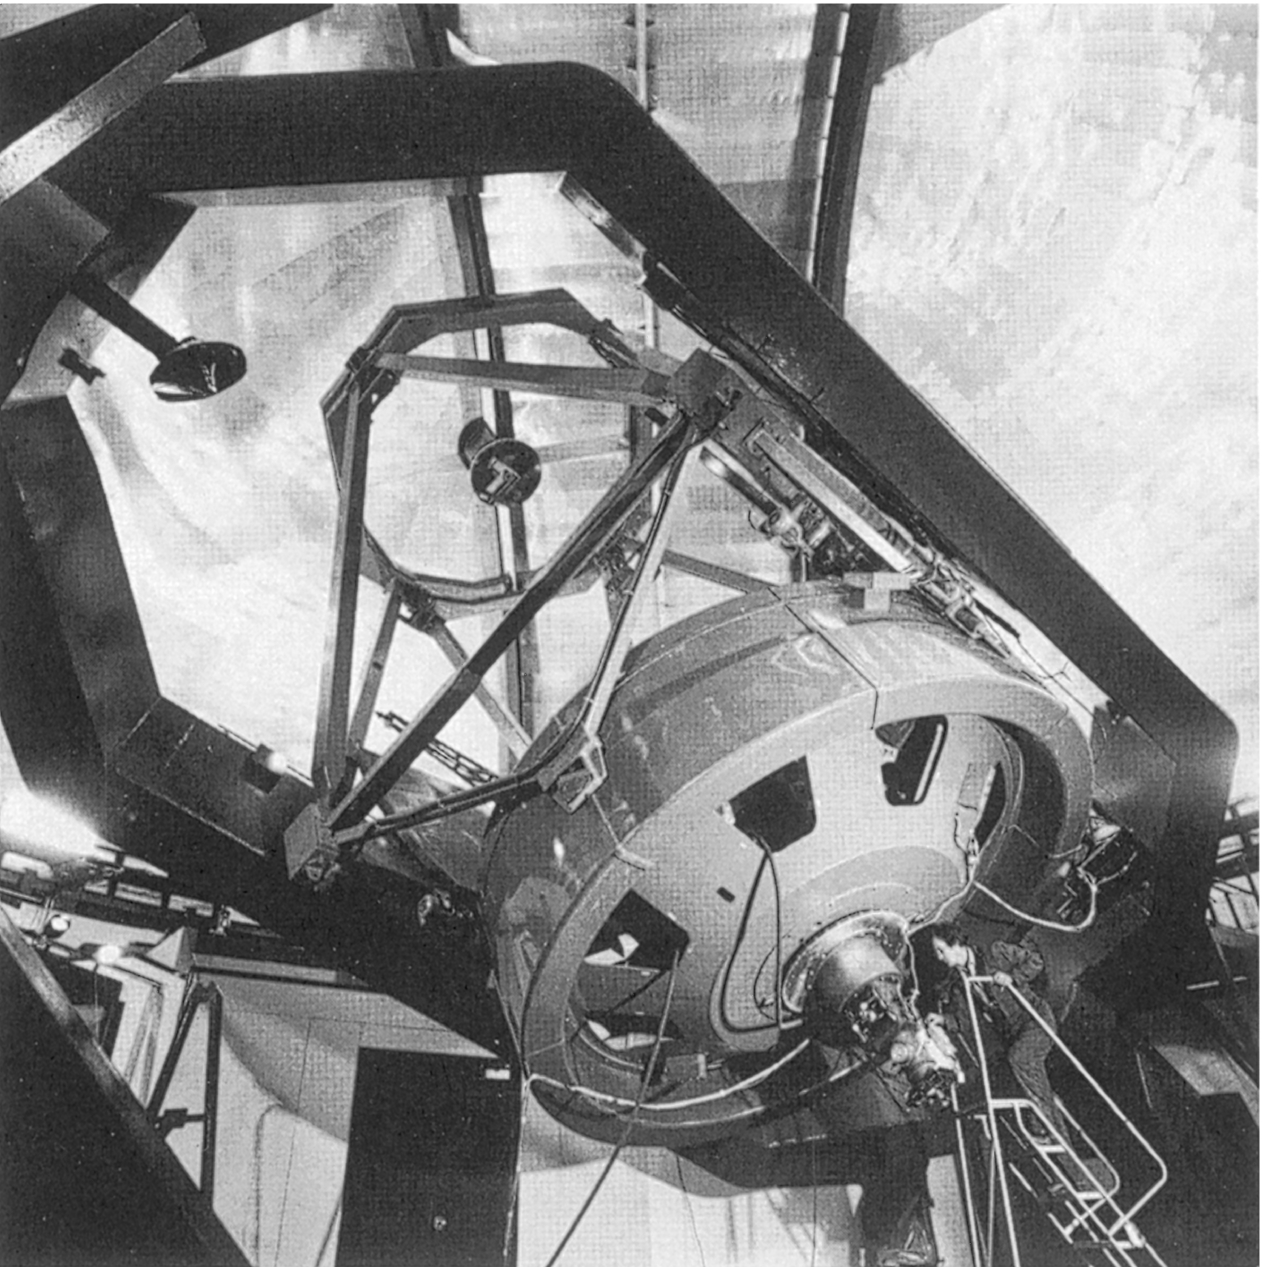
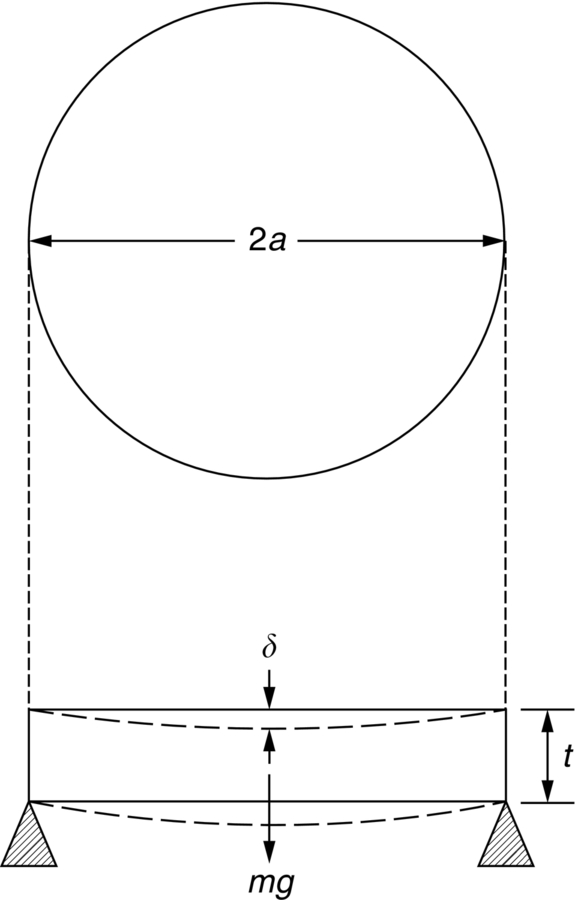
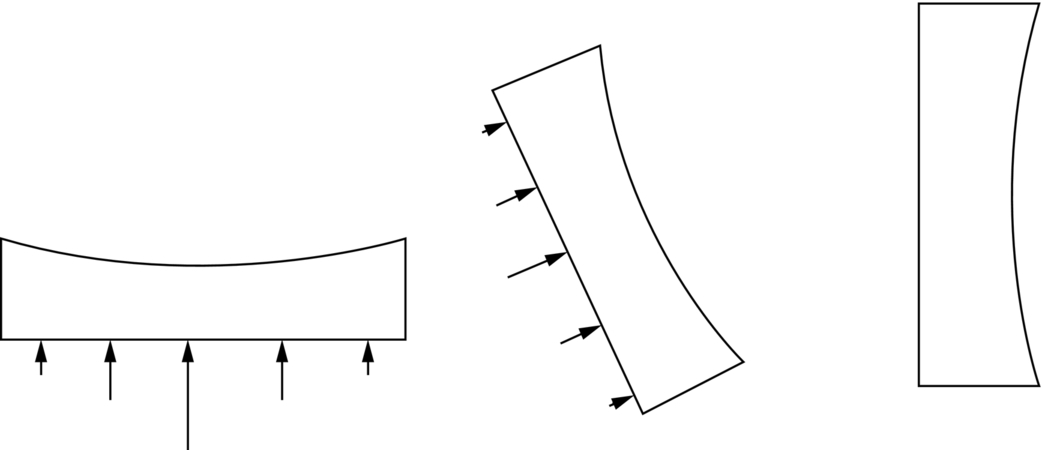
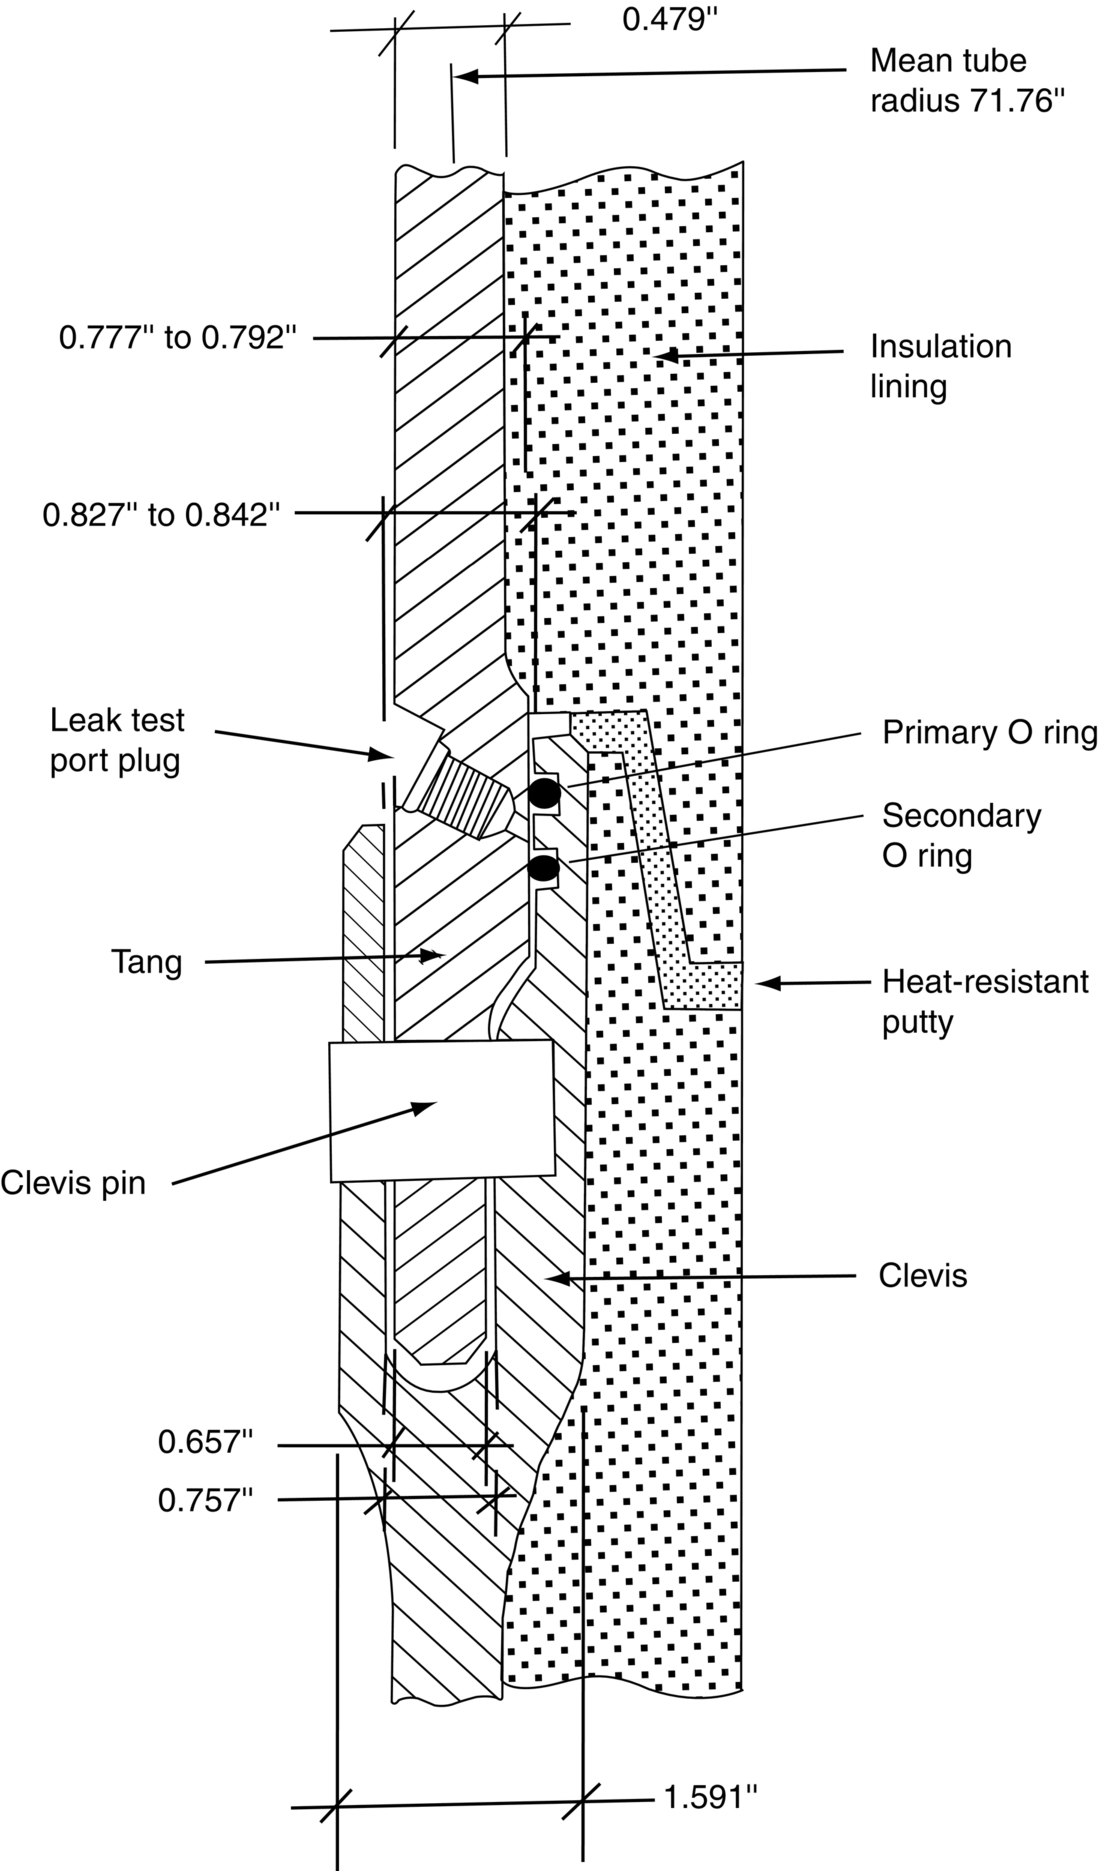
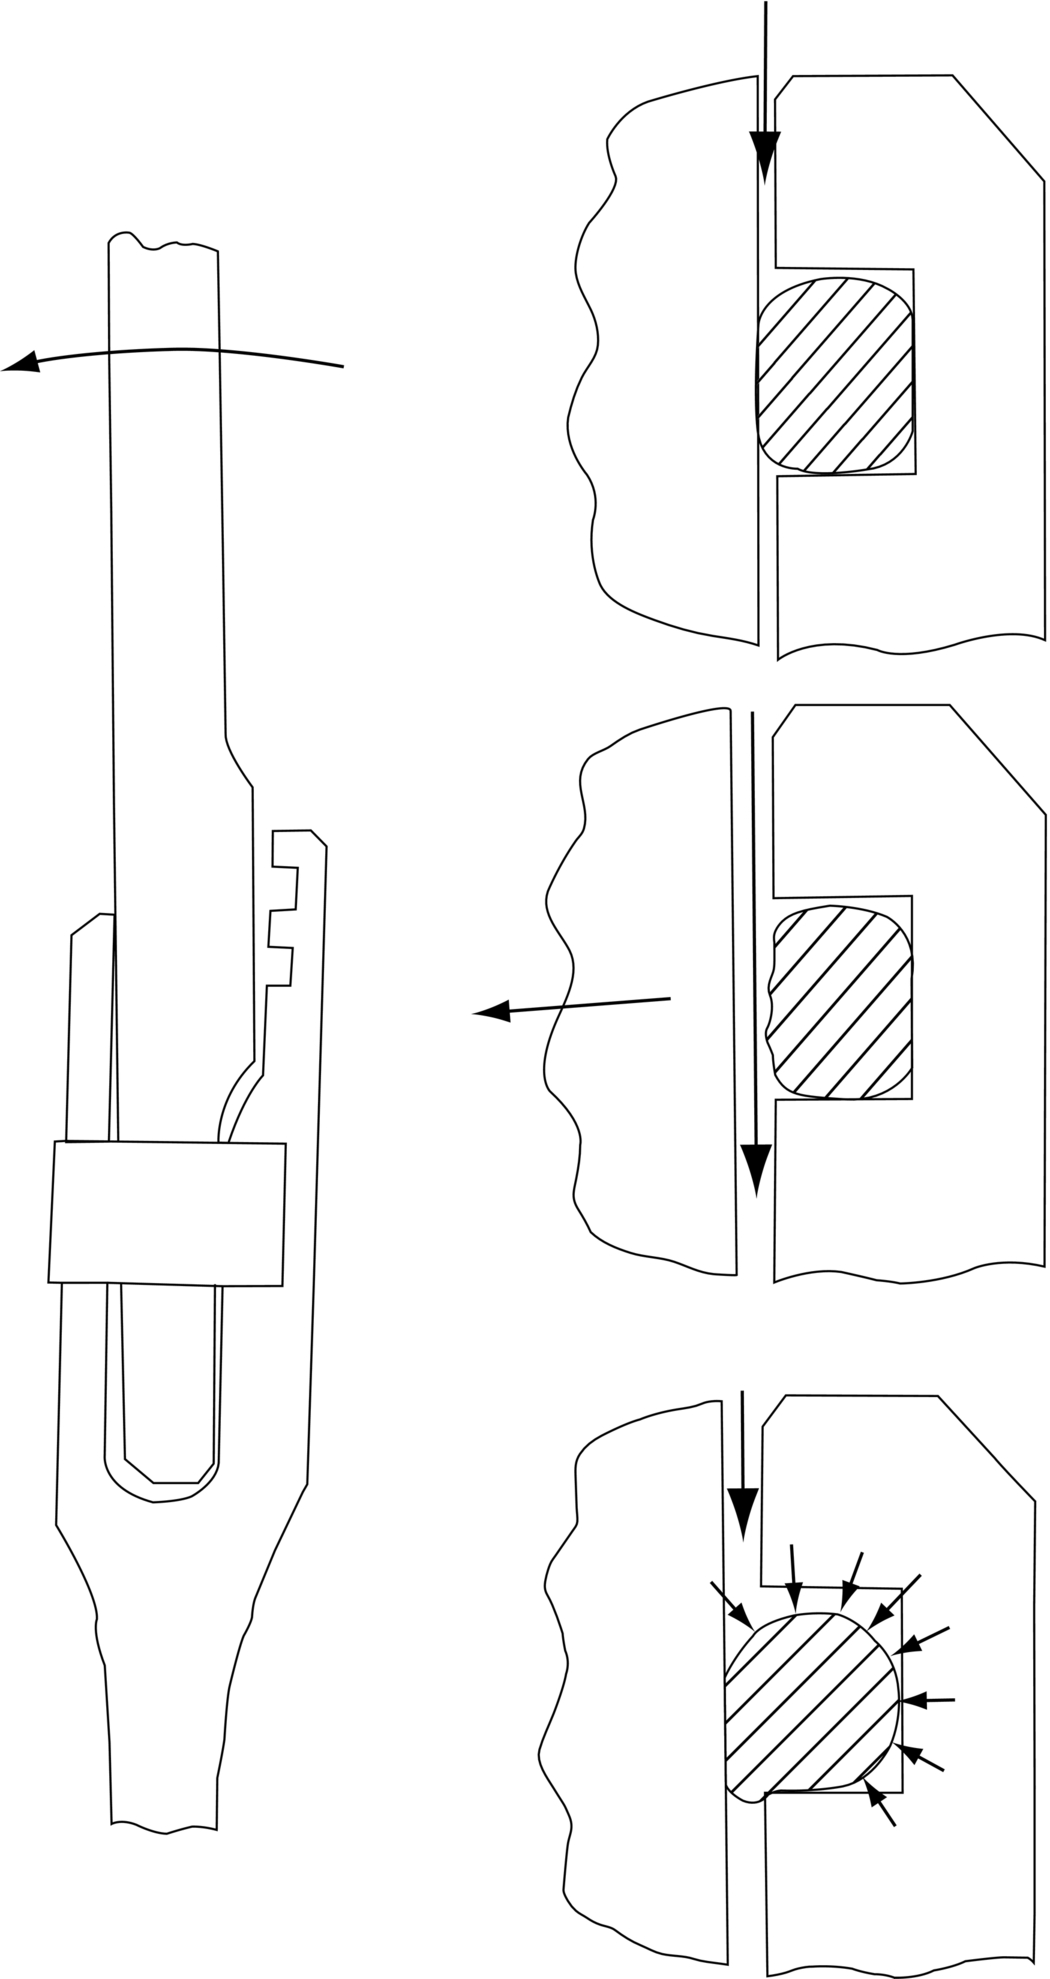
section epub:type=”chapter”> This chapter discusses three case studies in modulus-limited design. The first case study is on selecting materials for racing yacht masts. A good way to compare the performance of different materials in this type of application is to look at the mechanics of a cantilever beam in bending. The second case study is on designing a mirror for a large reflecting telescope. In simple terms, the mirror is an inert backing (of low-expansion glass, weighing 14.5 tons) for a very thin layer of vapor-deposited aluminum, 100 nm thick. Before coating, it is ground and polished to the shape of a parabola of revolution. The final dimensions must be incredibly accurate, otherwise the optical image seen through the telescope may not be sharp. The third case study is on the Challenger space shuttle disaster. On 28 January 1986, the U.S. space shuttle Challenger caught fire and broke up 73 seconds after lift-off. Together with the break-up of the space shuttle Columbia during re-entry on 1 February 2003, these are the worst accidents in the history of space travel. The circumstances of the disaster are well known and are extensively documented in the report of the Presidential Commission (the Rogers report) and many other sources. Figure 8.1 shows a typical mast from a modern racing yacht. It is built in the form of a thin-walled tube, and is fabricated from carbon fiber reinforced polymer—CFRP (which is why it appears black). To win long-haul ocean races, these yachts need to have every advantage that high-performance materials can give, in terms of maximum strength and stiffness, plus minimum weight and aerodynamic drag. The clip shows conditions on a typical ocean race—the Sydney to Hobart. The yacht is travelling at over 10 knots, and gear is being worked hard to move along as fast as possible. When storms are encountered (as they were shortly after this clip was taken), gear such as masts and rigging is exposed to very high loadings indeed, and masts can even be lost overboard; see http://www.youtube.com/watch?v=MzePFwYk88c&feature=related A good way to compare the performance of different materials in this type of application is to look at the mechanics of a cantilever beam in bending (see Figure 8.2). Equations for the elastic bending of beams are given in Chapter 7 —the closest result is for a cantilever subjected to a uniformly distributed loading. This is because the boom and the mainsail impose a lateral loading on the mast that is roughly uniform along the length of the mast. The following are the equations to use: Combining these two equations gives for the bending stiffness of the tube. The mass of the beam is given by The length and radius of the tube are fixed by the design, leaving the wall thickness t as the only dimensional variable. Substituting for t from Equation (8.4) into Equation (8.3) gives The mass of tube for a specified bending stiffness is therefore minimized by selecting a material with the minimum value of the material index Table 8.1 gives data for some candidate materials for this application. With the exception of CFRP, there is clearly not much to choose between any of these materials. Historically, masts for sailing ships were made from wood; that was the only suitable material that was available, and was very good at doing the job. With the advent of larger ships and steel at the end of the nineteenth century, masts were increasingly made from steel—equally good at the job, but available in much larger sizes to order, and with much better consistency of properties. From the 1960s, masts—especially for yachts and sailing dinghies—have almost always been made from aluminum alloy, mainly because of the corrosion problems with steel in thin sections. But CFRP gives a dramatic improvement in performance—a weight saving of a factor of 5 or more over the alternatives. It is little wonder that it is universally used in large ocean racers. But why is it not used more extensively? Price is the major factor here—CFRP costs 30 times more than aluminum alloys (see Table 2.1), and is only justified when there is plenty of money to pay for it. Finally, it is not surprising in view of this analysis that tubular members made from natural composite materials have been used for millenia—bamboo for buildings, cane for furniture, reed for roofing, and so on. Figure 8.3 shows an example of such a material still in use today. Figure 8.4 shows a typical large reflecting telescope—the U.K.’s infrared telescope (UKIRT), situated on the summit plateau of Mauna Kea, Hawaii—13,796 ft above sea level. A list of the world’s largest optical telescopes can be found at http://astro.nineplanets.org/bigeyes.html The classic big reflector is the Hale 200″ (5.1 m), located on the Palomar Mountain, in California. Completed in 1948, until 1993 it was the world’s largest correctly operating optical telescope. The following links give details of the construction, in particular the mirror and its supporting mechanism—we will return to these critical design solutions at the end of the case study. See also 33 21 22.54 N 116 51 53.61 W in Google Earth (http://www.astro.caltech.edu/palomar/; http://articles.adsabs.harvard.edu//full/1950PASP…62…91B/0000091.000.html). In simple terms, the mirror is an inert backing (of low-expansion glass, weighing 14.5 tons) for a very thin layer of vapour-deposited aluminum, 100 nm thick. Before coating, it is ground and polished to the shape of a parabola of revolution. The final dimensions must be incredibly accurate, otherwise the optical image seen through the telescope will not be sharp. In service, the mirror must hold an accuracy of 2 millionths of an inch (0.05 μm)—a huge technical challenge. Not surprisingly, the cost of such a telescope is enormous. However, much of the cost is associated with the steel framework that supports the mirror and the other optical components, and makes them move to follow the stars. The scaling laws of these structural elements is such that the cost of the telescope increases at a much faster rate than just the mirror diameter. So there is a big incentive to select materials for mirrors that reduce the mirror mass as much as possible. At its simplest, a telescope mirror is a circular disc of diameter 2a and thickness t simply supported at its periphery (Figure 8.5). When horizontal, it will deflect under its own weight m, but when vertical it will not deflect significantly. The equation for the elastic deflection needs to be found from a much more extensive source of results than we have given in Chapter 7—see Roark’s formulas for stress and strain (Young and Budynas—in the References). It is for a material with Poisson’s ratio fairly close to 0.33. The mass of the mirror is given by Substituting for t from Equation (8.8) into Equation (8.7) gives δ and a are fixed by the design, so the only variable remaining on the right-hand side of Equation (8.9) is the materials index Table 8.2 gives data for some candidate materials for this application. CFRP is no longer clearly the lightest material—we cannot exploit its high unidirectional modulus because we must have the same modulus in all directions in the plane of the mirror, and this means we have to use a quasi isotropic laminate, with a much lower modulus. In fact, wood is now equal to CFRP—but we cannot use it because it is far too unstable dimensionally. Next up is glass, which also has the advantages that it is very stable, and can be ground and polished to a mirror finish—so it is not surprising that nearly all telescope mirrors continue to use it, even the Hubble space telescope! http://en.wikipedia.org/wiki/Hubble_Space:Telescope Materials selection based on the materials index is a useful first step towards identifying potential new ways of doing things—CFRP yacht masts are a good example of the huge weight savings possible by using a new material. But in some cases, the traditional material is the best. And the materials index is sometimes too simplistic to incorporate other design-based solutions to the problem. Two clever engineering solutions are used in the Hale telescope to minimize the deflection of the mirror under gravitational loading. First, the mirror is not a plain disc—its underside is deeply ribbed in order to reduce weight while retaining a stiff structural shape (the weight saving is 42%). Second, mirror sag is offset by applying mechanical forces to the underside of the mirror at 36 separate locations (Figure 8.6). These forces are provided by a system of jacks which are actuated by weighted levers—each jack is unique to each of the 36 locations. As the mirror is tilted (and the sag decreases), the jacks back off automatically; due to clever mechanical design, the gravitational pull on the weighted levers is made to back off at the same rate as the pull on the mirror. This is an entirely passive control mechanism, and needs no external actuators or control systems. Modern reflectors, on the other hand, use highly sophisticated computer controlled actuators to do this job—the signals to the actuators are even driven in real time by aberrations in the optical images, so the telescope is continually correcting itself. This has permitted optical telescopes to be built with mirrors as large as 10 m—the Keck telescopes on Mauna Kea each comprise 36 separate glass mirror segments, all of which are kept precisely aligned by this type of control system. Even larger reflectors are planned using this system. The message here is clear—in many applications, control engineering solutions are now outclassing solutions based on materials selection. And here is a solution to the mirror problem that does not even require us to use a solid material! (http://en.wikipedia.org/wiki/Liquid_mirror) On 28 January 1986, the U.S. space shuttle Challenger caught fire and broke up 73 seconds after lift-off. Together with the break-up of the space shuttle Columbia during re-entry on 1 February 2003, these are the worst accidents in the history of space travel. The circumstances of the disaster are well known, and are extensively documented in the report of the Presidential Commission (the Rogers report) and many other sources: The disaster started with a blow-by of hot combustion gases through a joint in the steel casing of one of the two solid rocket boosters, or SRBs. You can see this blow-by immediately after lift-off on the YouTube clip—at 4 minutes 36 seconds. (http://www.youtube.com/watch?v=zk_wi4QD5WE) There is a puff of black smoke from the lowest (aft end) joint of the right-hand SRB—in fact, there was a short sequence of repeated smoke puffs from T + 0.678 s to T + 2.733 s. The blow-by then stopped, but started up again after 59 s, resulting in burn-through of the steel casing at this location, breaching of the huge external propellant tank, fracture of the lower connection between the SRB and the propellant tank and rapid disintegration of the whole assembly. Each SRB was made from seven lengths of large diameter steel tube, 12 ft (144″ or 3658 mm) outside diameter, and 0.479″ (12.17 mm) wall thickness. The overall length of the SRB was 149 ft (45.5 m). The six upper (forward) lengths of tube were joined end-to-end in pairs at the factory in Promontory, Utah, making four separate sections to be transported by rail to the launch site at the Kennedy Space Center (28 36 31.04 N 80 36 15.36 W). These four sections were then assembled at the launch site, which involved making three “field” joints. It was the lowest (aftermost) of these field joints which failed during launch. Figure 8.7 shows a simplified cross section through this joint. The end of one tube (the “tang”) plugs into a groove (the “clevis”) in the end of the next tube. The joint is made pressure-tight by two synthetic rubber “O” rings, which sit in circumferential grooves machined in the clevis. After assembly, the O rings are compressed slightly (“nipped”) because the as-manufactured diameter of the O ring (0.280″) is slightly greater than the gap between the tang and the bottom of the O-ring groove. The joint is tested for pressure tightness after assembly by pressurising the cavity between the two O rings with air introduced through the test port. If the air pressure in the pressurising system holds the initial 50 psi for long enough, then the joint is deemed to be correctly assembled. However—something we will return to in a moment—the pressure test will push the O rings in opposite directions: the upper O ring will be pushed upwards until it sits against the top face of the groove, and the opposite will happen for the lower O ring. After ignition, the pressure of the combustion gases in the SRB climbs to its steady value of 912 psi (6.303 MN m–2) within 0.600 s. This is supposed to force the heat-resistant putty along its channel, compress the air in the space above the O ring, and push the O ring down so it forms a seal against the tang and the lower face of the groove. In practice, things did not work out this way with real joints. Figure 8.7 shows that the wall thickness of the SRB is much greater at the joint than in the main run of the tube—1.591″ as compared to 0.479″, a factor of 3.32 times thicker. Under the internal pressure of 912 psi, the main run of the tube expands elastically. The worked example at the end of this chapter shows how to calculate this expansion. At 912 psi, it is 0.283″ (7.18 mm) on tube radius. The joint also expands elastically, but because it is much thicker, it expands a lot less—by 0.183″ (4.64 mm) radially. This leads to what is termed “joint rotation”—shown schematically in Figure 8.8. You can model this effect very easily with a party balloon and a rubber band, as shown in Figure 8.9. What joint rotation does is to increase the gap between the tang and the clevis. Tests showed that the gap would open by an average value of 0.029″ over the timescale of 0.600 s to reach the steady operating pressure. During this time, the O ring lost its initial compression, and lost its seal. As we explained in Chapter 6, when rubbers are warmed up above the glass temperature TG the Van der Waals bonds melt, and this allows the polymer chains to slide over one another when the rubber is strained. But this chain sliding takes time, and the rate at which it takes place is very dependent on temperature—after 0.6 s, the O ring will recover 60% of its compression at 24°C, 40% of its compression at 10°C, but only 20% of its compression at 0°C. This was elegantly demonstrated to the Commission by the Nobel prize-winning physicist Richard Feynman: http://www.youtube.com/watch?v=8qAi_9quzUY If the launch is carried out in warm weather, the chances are that the O ring will rapidly reseat itself under the action of the pressurized putty. However, at lower temperatures reseating takes much longer, and during this time, combustion gases can make their way down to the O ring—and even leak past it—before the O ring has had a chance to reseat. The hot gases burn back the surface of the O ring, so there is a race on for the O ring to re-seat before it gets eroded too much. The Challenger launch took place in cold weather—the joint temperature was estimated to have been around 0°C—and the O ring could not re-seat before it burnt out. At this stage, the second O ring should have come into operation as a back-up, but this also would not reseat in time and burnt out, leaving a clear leak path through the joint. Engineers had been aware for some time of this flaw in the joint design. Because the SRBs were designed to be recoverable, post-mission inspections of joints had been made, and the tell-tale signs of blow-by had been found in a number of SRBs. Not surprisingly, these were more common at the lower launch temperatures. But the launch on 28 January 1986 was at the lowest temperature ever, by some margin. Engineers at the manufacturers were strongly opposed to the launch because of this, but were overruled—on the basis that they did not have enough information on the behavior of the O rings at low temperatures to prove that the launch was dangerous! A very basic knowledge of elastic behavior has shown how the apparently simple use of an O ring seal can go badly wrong—because of the textbook elastic behavior of a pressurized tube of varying wall thickness, and the textbook time-dependent behavior of rubbers. To end, here are a few quotes from the Rogers report, which make compelling reading for any engineer involved in managing risk. [Mr. Ray], when the joint was first designed, the analysis produced by Thiokol says the joint would close, the extrusion gap would actually close. We had quite a debate about that until we did a test on the first couple of segments that we received from the manufacturer, which in fact showed that the joint did open. At that time, we really nailed it down. We got some very accurate numbers on joint rotation, and we know for a fact that during these tests the joint rotated. The primary O-ring was extruded up into the joint. The secondary O ring did in fact detach from the seat. One of the most astute summaries of the cause came from a lawyer, not an engineer. David Acheson, one of members of the Commission, said: “A lot of material we have received, one reads that the designers, presumably both the corporate designers and the NASA supervisors, believe the joint was designed to compress and seal in the gas tight under combustion pressure. And it turns out very quickly in the joint history that it did the opposite. It opened up. I just don’t understand why the program then decided to go into a lot of little fixes to see if you could compensate for the fundamental error.” The Space Shuttle’s Solid Rocket Booster problem began with the faulty design of its joint and increased as both NASA and contractor management first failed to recognize it as a problem, then failed to fix it and finally treated it as an acceptable flight risk. Morton Thiokol, Inc., the contractor, did not accept the implication of tests early in the program that the design had a serious and unanticipated flaw. NASA did not accept the judgment of its engineers that the design was unacceptable, and as the joint problems grew in number and severity NASA minimized them in management briefings and reports. Thiokol’s stated position was that “the condition is not desirable but is acceptable.” Neither Thiokol nor NASA expected the rubber O-rings sealing the joints to be touched by hot gases of motor ignition, much less to be partially burned. However, as tests and then flights confirmed damage to the sealing rings, the reaction by both NASA and Thiokol was to increase the amount of damage considered “acceptable.” At no time did management either recommend a redesign of the joint or call for the Shuttle’s grounding until the problem was solved. NASA and Thiokol accepted escalating risk apparently because they “got away with it last time.” As Commissioner Feynman observed, “the decision making was: a kind of Russian roulette. [The Shuttle] flies [with O-ring erosion] and nothing happens. Then it is suggested, therefore, that the risk is no longer so high for the next flights. We can lower our standards a little bit because we got away with it last time…. You got away with it but it shouldn’t be done over and over again like that.” In Chapter 7, we looked at two things that are useful for analysing the strains that the internal pressure generates in the solid rocket booster casing. Looking again at Example 7.5, we can see that the applied stress state in the wall of the casing consists of a hoop stress given by The equation that is relevant to the hoop strain is obviously Poisson’s ratio is 1/3 for steel, so the hoop strain becomes The casing has an outer diameter of 12 ft (144″), and a wall thickness of 0.479″. The inner diameter of the tube is 144″—2 × 0.479″ = 143.04″. The mean diameter of the tube is 143.52″, so the mean radius of the tube is half this = 71.76″. NASA conducted a pressure test on an SRB casing—this used water as the pressurising medium, so a fracture of the casing would not cause an explosion (it would if air had been used!). The test pressure used was 1004 psi (6.939 MN m–2). At this pressure, the hoop stress is given by Young’s modulus for the steel is 200.4 GN m–2, so the hoop strain is This produces a radial expansion of the casing of 0.00433 × 71.76″ = 0.311″. NASA measured a radial expansion during the test which is exactly the same—0.311″. Not bad for a simple analysis! When all the other parameters in this equation are fixed, the mass is proportional to the wall thickness t. r will also be fixed. The cross-sectional area of the tube (2πrt) will thus be proportional to t. The minimum value of m corresponds to the value of t, which gives a cross-sectional area just sufficient to carry the torque, which the prop shaft is required to transmit.
Case Studies in Modulus-Limited Design
Publisher Summary
8.1 Case Study 1: Selecting Materials for Racing Yacht Masts
8.2 Case Study 2: Designing a Mirror for a Large Reflecting Telescope
8.3 Case Study 3: The Challenger Space Shuttle Disaster

Postscript
Worked example
 , an axial stress given by
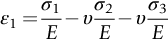
  , and a free surface stress σ3 = 0. Because the stress state is not uniaxial, we need to use the equations for stresses and strains in 3 dimensions to work out the hoop strain in the SRB casing. These were given in Example 7.11:
Examples
Answers