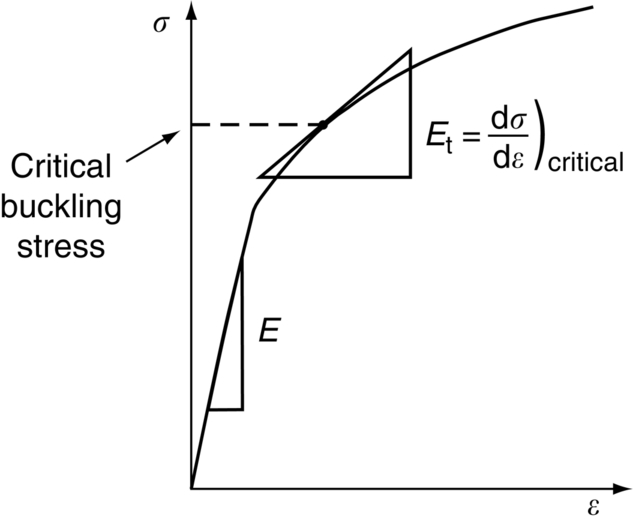
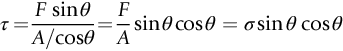
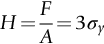
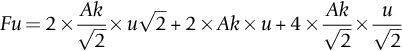
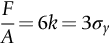
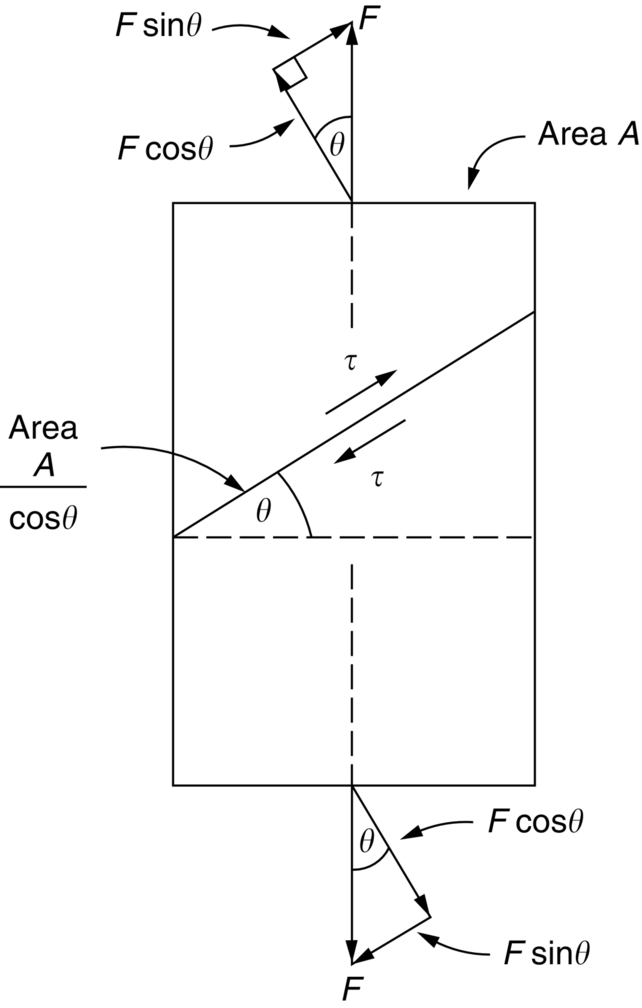
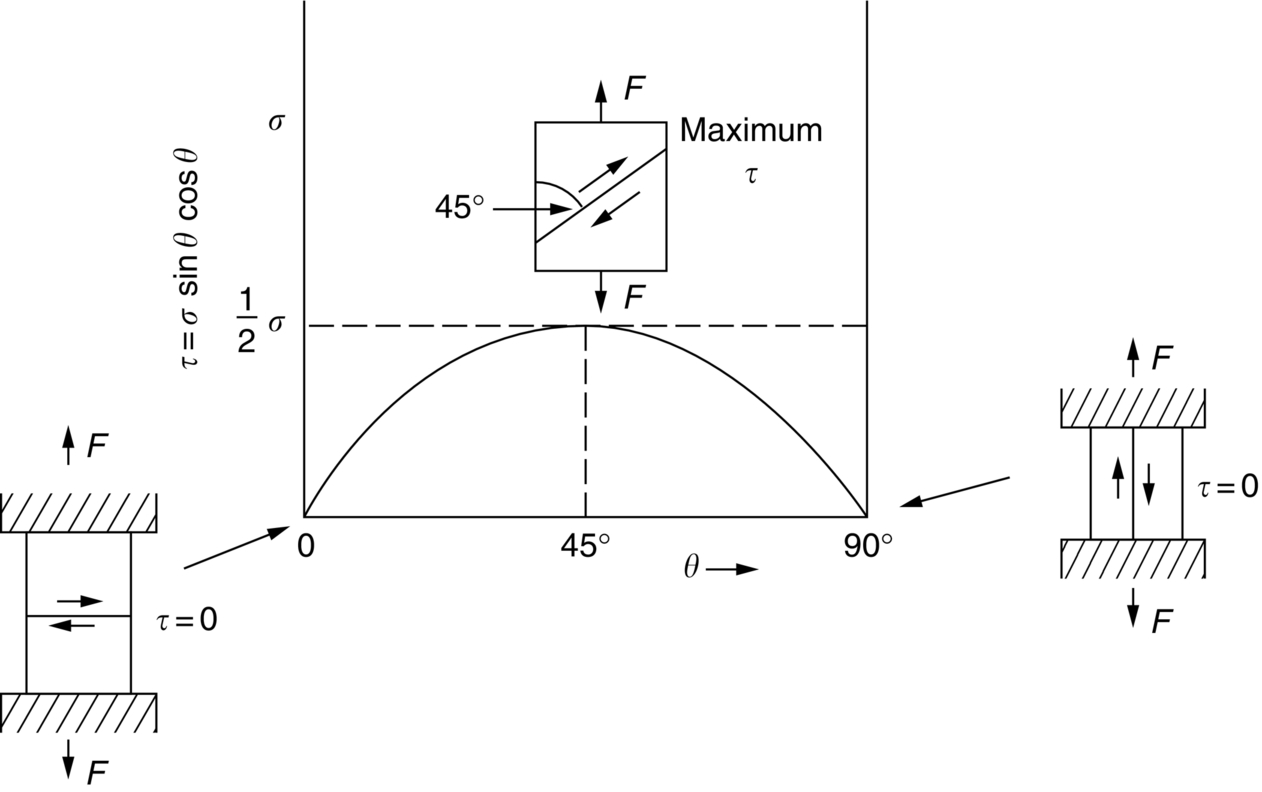
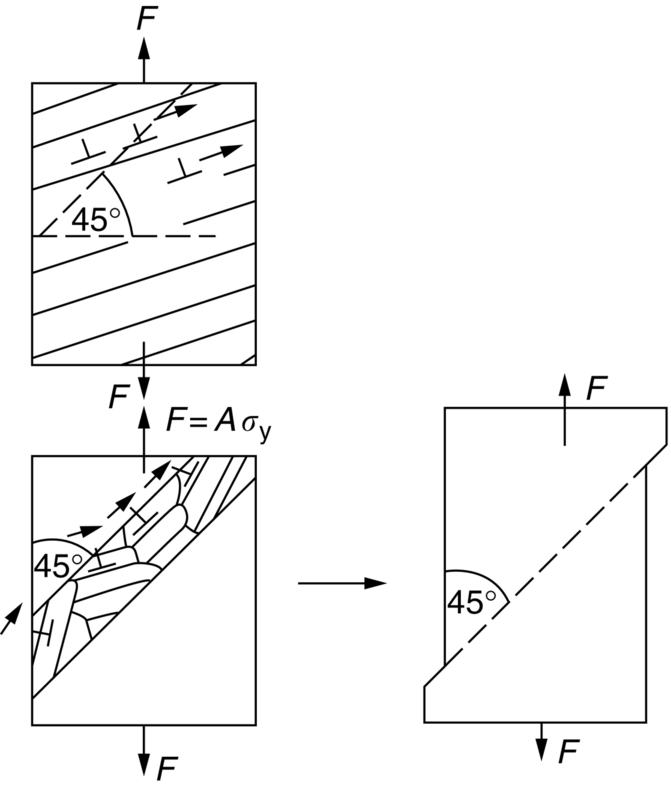
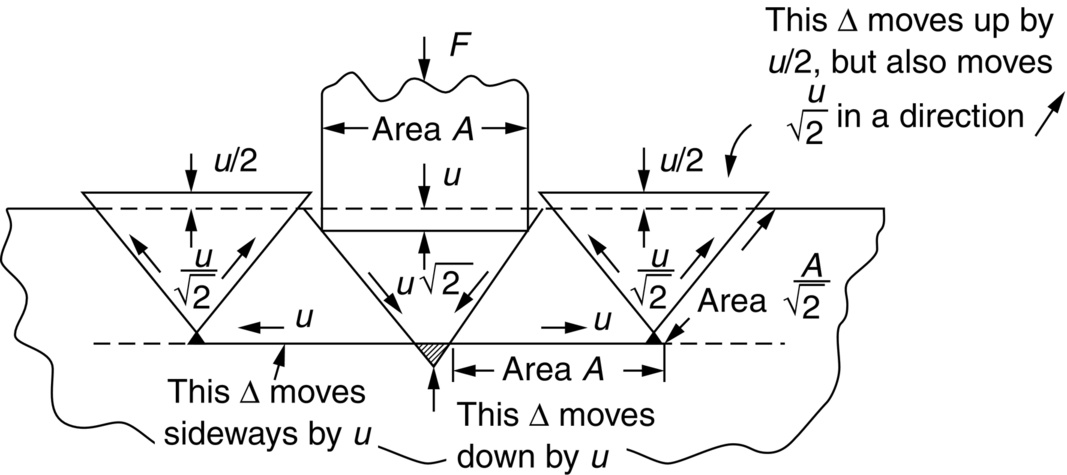
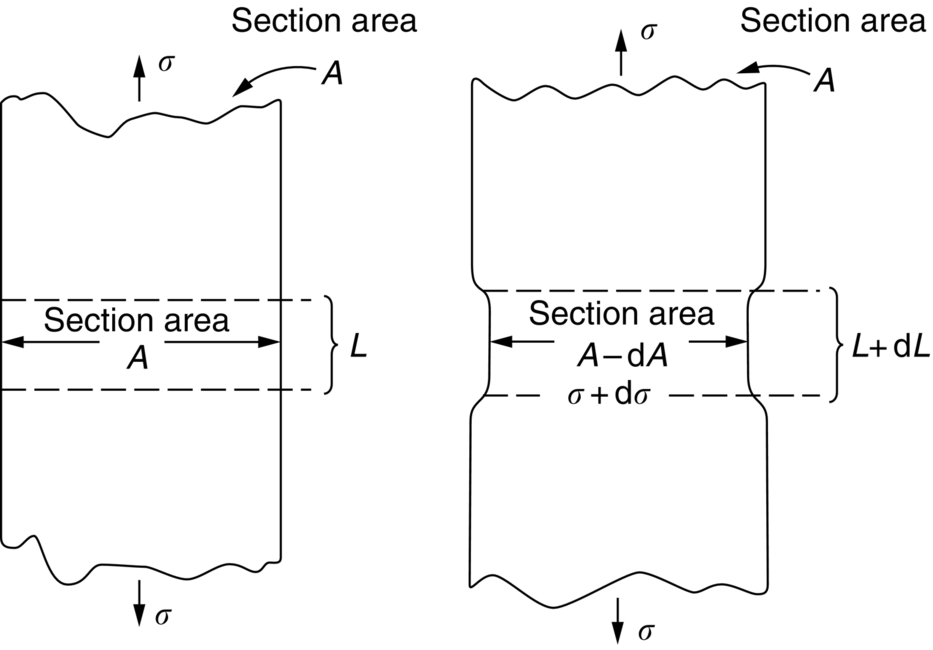
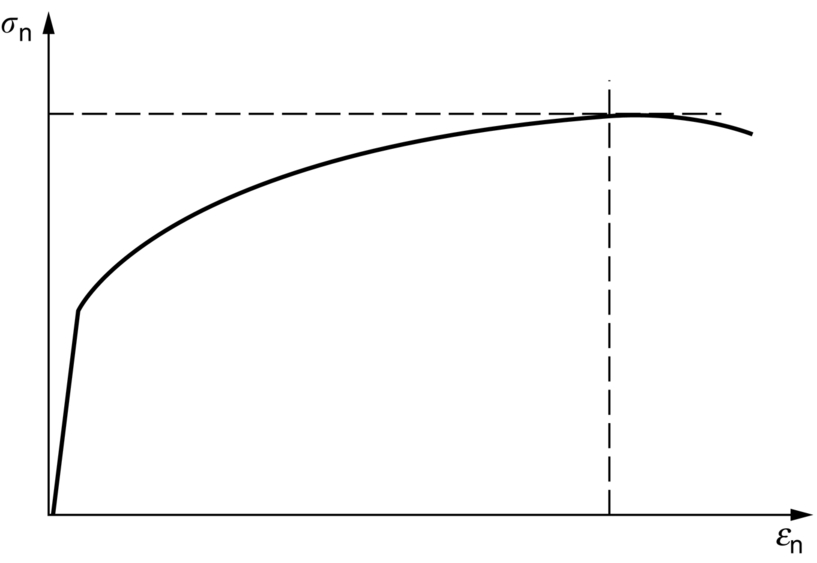
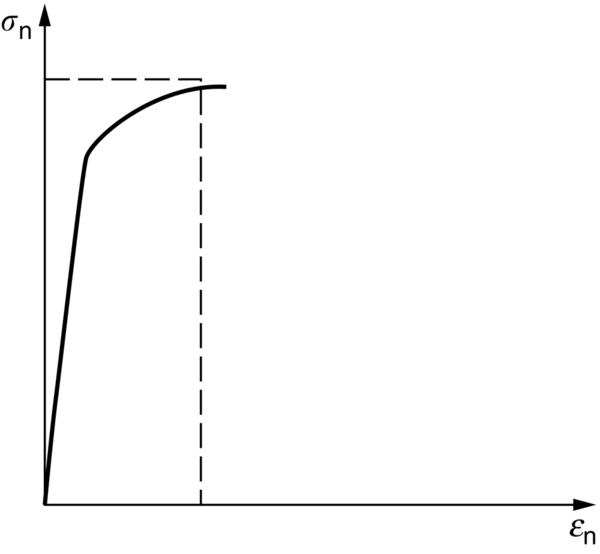
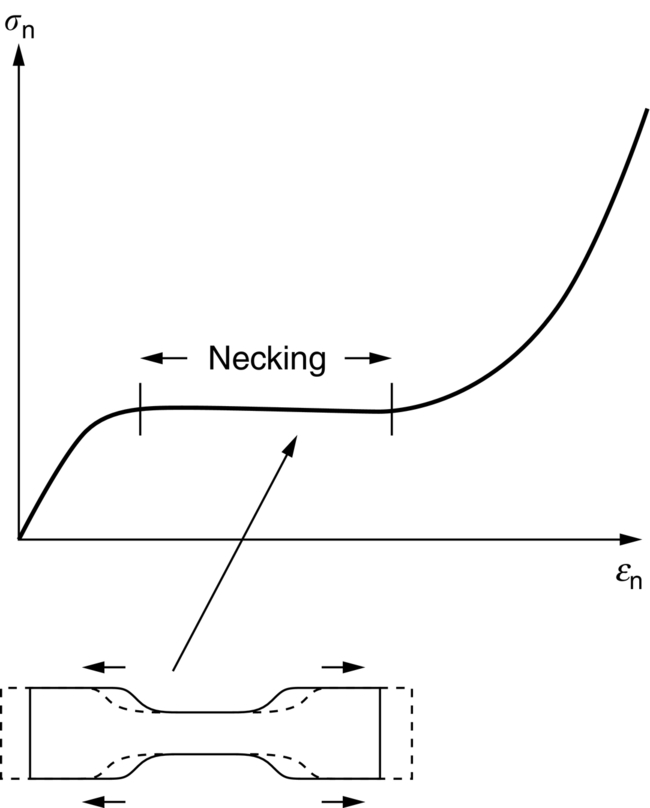
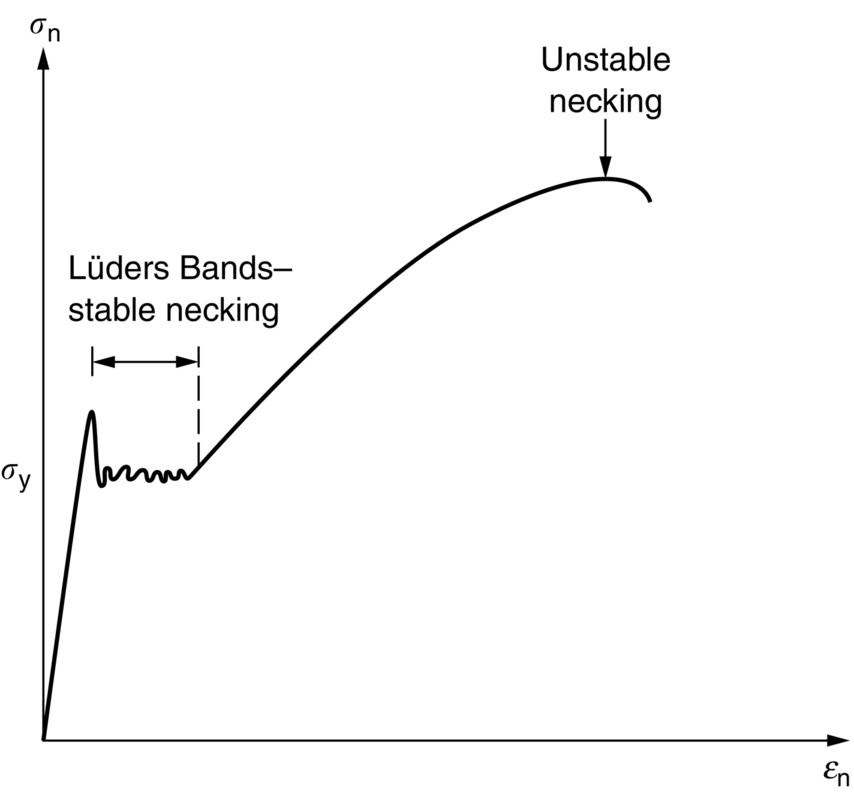
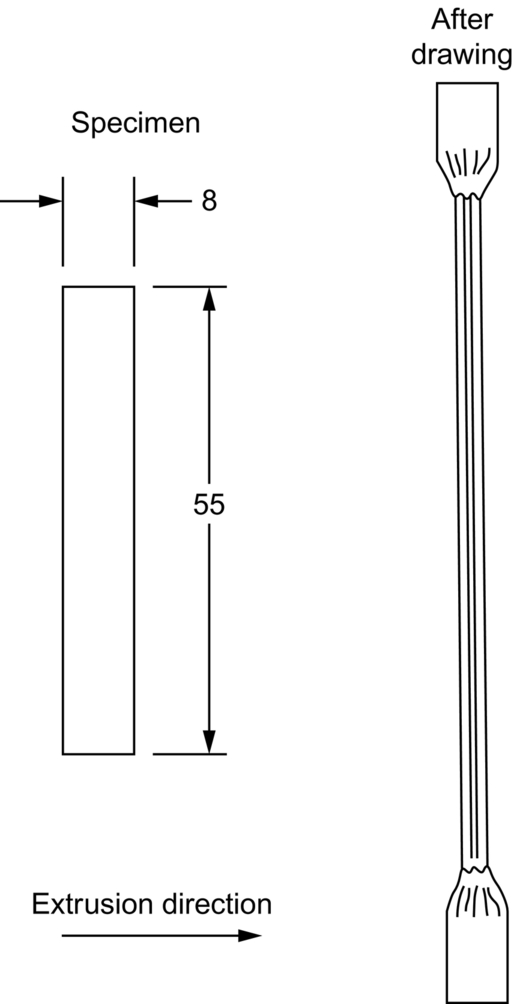
section epub:type=”chapter”> Plastic flow occurs by shear. Dislocations move when the shear stress on the slip plane exceeds the dislocation yield strength τy of a single crystal. If this is averaged over all grain orientations and slip planes, it can be related to the tensile yield strength σy of a polycrystal by σy = 3τy. In solving problems of plasticity, however, it is more useful to define the shear yield strength k of a polycrystal. It is equal to σy/2, and differs from τy because it is an average shear resistance over all orientations of slip plane. When a structure is loaded, the planes on which shear may occur can often be identified or guessed, and the collapse load calculated approximately by requiring that the stress exceed k on these planes. This chapter shows that k = σy/2, and uses k to relate the hardness to the yield strength of a solid. The chapter examines the tensile instabilities that appear in the drawing of metals and polymers. Plastic flow occurs by shear. Dislocations move when the shear stress on the slip plane exceeds the dislocation yield strength τy of a single crystal. If this is averaged over all grain orientations and slip planes, it can be related to the tensile yield strength σy of a polycrystal by σy = 3τy (Chapter 11). In solving problems of plasticity, however, it is more useful to define the shear yield strength k of a polycrystal. It is equal to σy/2, and differs from τy because it is an average shear resistance over all orientations of slip plane. When a structure is loaded, the planes on which shear will occur can often be identified or guessed, and the collapse load calculated approximately by requiring that the stress exceed k on these planes. In this chapter, we show that k = σy/2, and use k to relate the hardness to the yield strength of a solid. We then examine tensile instabilities which appear in the drawing of metals and polymers. A tensile stress applied to a piece of material will create a shear stress at an angle to the tensile stress. Let us examine the stresses in more detail. Resolving forces in Figure 12.1 gives the shearing force as Thus the shear stress, τ is If we plot this against θ as in Figure 12.2 we find a maximum τ at θ = 45° to the tensile axis. This means that the highest value of the shear stress is found at 45° to the tensile axis, and has a value of σ/2. Now, from what we have said in Chapters 10 and 11, if we are dealing with a single crystal, the crystal will not in fact slip on the 45° plane—it will slip on the nearest lattice plane to the 45° plane on which dislocations can glide (Figure 12.3). In a polycrystal, neighboring grains each yield on their nearest-to-45° slip planes. On a microscopic scale, slip occurs on a zigzag path; but the average slip path is at 45° to the tensile axis. The shear stress on this plane when yielding occurs is therefore τ = σy/2, and we define this as the shear yield strength k: The concept of shear yielding—where we ignore the details of the grains in the polycrystal and treat the material as a continuum—is useful in many respects. For example, we can use it to calculate the loads that would make the material yield for all sorts of quite complicated geometries. A good example is the problem of the hardness indenter that we referred to in the hardness test in Chapter 9. Then, we stated that the hardness We assume that the material does not work-harden so as the indenter is pushed into the material, the yield strength does not change. For simplicity, we consider a two-dimensional model. (A real indenter is three-dimensional, but the result is, for practical purposes, the same.) As we press a flat indenter into the material, shear takes place on the 45° planes of maximum shear stress shown in Figure 12.4, at a value of shear stress equal to k. By equating the work done by the force F as the indenter sinks a distance u to the work done against k on the shear planes, we get: This simplifies to from which But F/A = H so (Strictly, shear occurs not just on the shear planes we have drawn, but on myriad 45° planes near the indenter. If our assumed geometry for slip is wrong it can be shown rigorously by a theorem called the upper-bound theorem that the value we get for F at yield—the so-called “limit” load—is always on the high side.) Similar treatments can be used for all sorts of two-dimensional problems: for calculating the plastic collapse load of structures of complex shape, and for analyzing metal-working processes like forging, rolling, and sheet drawing. We now turn to the other end of the stress–strain curve and explain why, in tensile straining, materials eventually start to neck, a name for plastic instability. It means that flow becomes localized across one section of the specimen or component, as shown in Figure 12.5, and (if straining continues) the material fractures there. Plasticine necks readily; chewing gum is very resistant to necking. We analyze the instability by noting that if a force F is applied to the end of the specimen, then any section must carry this load. But is it capable of doing so? Suppose one section deforms a little more than the rest, as the figure shows. Its section is less, and the stress in it is therefore larger than elsewhere. If work-hardening has raised the yield strength enough, the reduced section can still carry the force F; but if it has not, plastic flow will become localized at the neck and the specimen will fail there. Any section of the specimen can carry a force Aσ, where A is its area, and σ its current strength. If Aσ increases with strain, the specimen is stable. If it decreases, it is unstable and will neck. The critical condition for the start of necking is that Then or But volume is conserved during plastic flow, so (prove this by differentiating AL = constant). So or This equation is given in terms of true stress and true strain. As we saw in Chapter 9, tensile data are usually given in terms of nominal stress and strain. From Chapter 9: If these are differentiated and substituted into the necking equation we get In other words, on the point of instability, the nominal stress–strain curve is at its maximum as we know experimentally from Chapter 9. To see what is going on physically, it is easier to return to our first condition. At low stress, if we make a little neck, the material in the neck will work-harden and will be able to carry the extra stress it has to stand because of its smaller area; load will therefore be continuous, and the material will be stable. At high stress, the rate of work-hardening is less as the true stress–true strain curve shows: that is, the slope of the σ/ɛ curve is less. Eventually, we reach a point at which, when we make a neck, the work-hardening is only just enough to stand the extra stress. This is the point of necking (Figure 12.6) with At still higher true stress Plastic instability is very important in processes like deep drawing sheet metal to form car bodies, cans, and so on. Obviously we must ensure that the materials and press designs are chosen carefully to avoid instability. Mild steel is a good material for deep drawing in the sense that it flows a great deal before necking starts. It can therefore be drawn very deeply without breaking (Figure 12.7). Aluminum alloy is much less good (Figure 12.8)—it can only be drawn a little before instabilities form. Pure aluminum is not nearly as bad, but is much too soft to use for most applications. Polythene shows a kind of necking that does not lead to fracture. Figure 12.9 shows its σn/ɛn curve. At quite low stress and necking begins. However, the neck never becomes unstable—it simply grows in length—because at high strain the material work-hardens considerably, and is able to support the increased stress at the reduced cross-section of the neck. This odd behavior is caused by the lining up of the polymer chains in the neck along the direction of the neck—and for this sort of reason drawn (i.e., “fully necked”) polymers can be made to be very strong indeed—much stronger than the undrawn polymers. Finally, mild steel can sometimes show an instability like that of polythene. If the steel is annealed, the stress–strain curve looks like that in Figure 12.10. A stable neck, called a Lüders Band, forms, and propagates (as it did in polythene) without causing fracture because the strong work-hardening of the later part of the stress–strain curve prevents this. Lüders Bands are a problem when sheet steel is pressed because they give lower precision and disfigure the pressing. Referring to Figure 12.9, we can easily demonstrate stable necking in polymers using strips cut from a polythene bag. You need to cut the strips across the bag (the polymer chains are already partially lined up along the length of the bag because of the forming process). You then grip each end of the strip between thumb and index finger, and pull out the strip as shown in the diagram. The results given in Chapter 7 for the elastic buckling of beams can be applied to situations where the buckling is plastic, provided Young’s modulus E is replaced in the equations by the tangent modulus Et which is defined in the following diagram.
Continuum Aspects of Plastic Flow
Publisher Summary
12.1 Introduction
12.2 Onset of yielding and shear yield strength, k
 . The area over which this force acts in shear is
12.3 Analyzing the hardness test
12.4 Plastic instability: necking in tensile loading
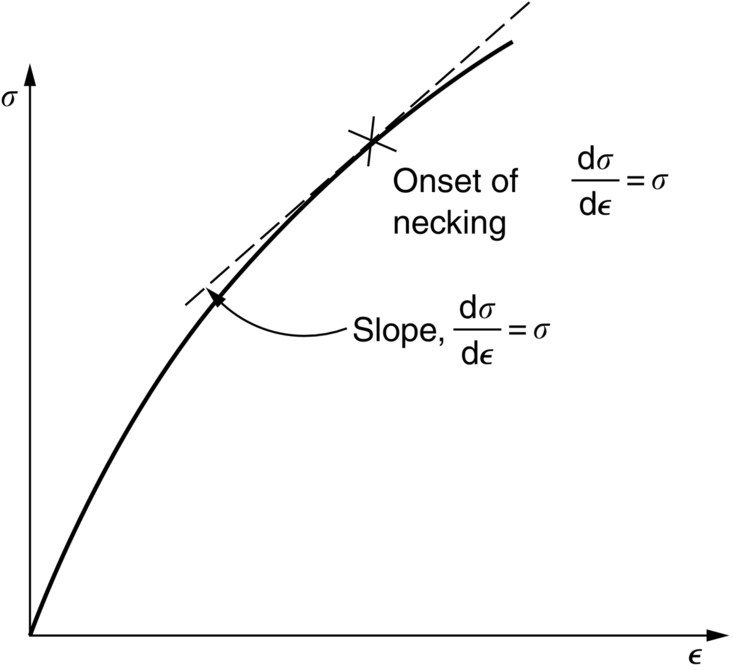
 , the rate of work-hardening decreases further, becoming insufficient to maintain stability—the extra stress in the neck can no longer be accommodated by the work-hardening produced by making the neck, and the neck grows faster and faster, until final fracture takes place.
Consequences of plastic instability
Worked example
Examples
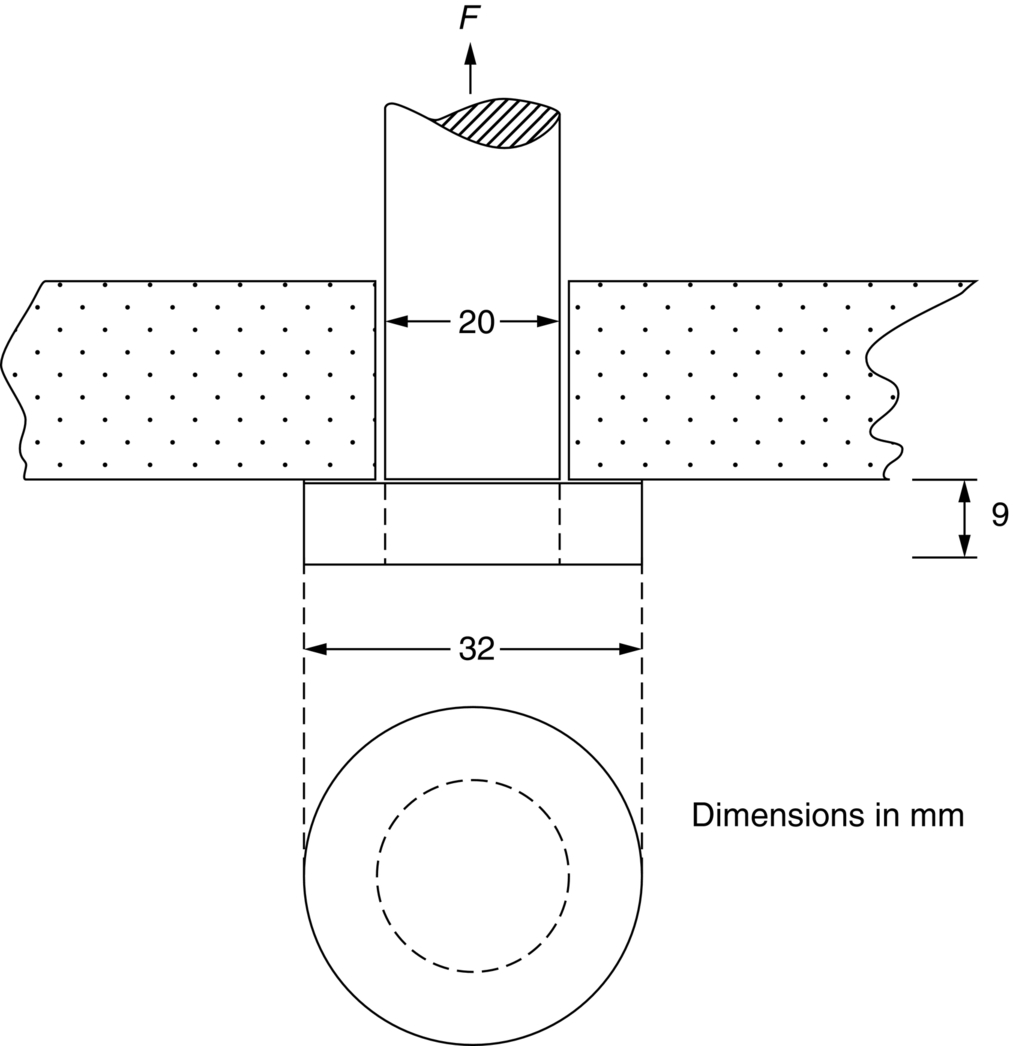
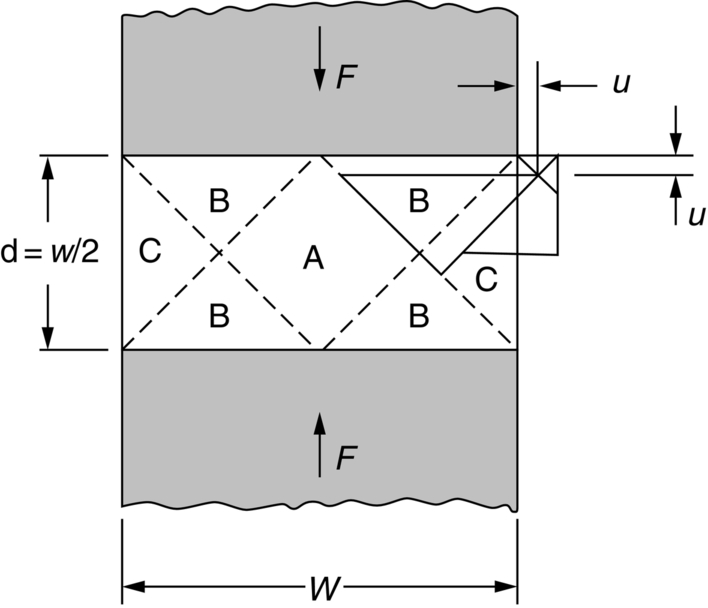
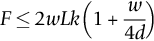
which defines upper bounds for all integral values of w/2d.
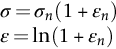
Estimate the tensile strength of the wire. Remember that the tensile strength is the nominal stress at onset of necking. You will first need to find the true strain at onset of necking, then the true stress at onset of necking, then use the equations in Section 12.4 to convert between true and nominal stresses and strains.
and n = 0.2, calculate the tensile strength of a material for which the indentation hardness is 600 MN m−2. You may assume that σTS = Ann/ɛn.
Answers
Plastic bending of beams, torsion of shafts, buckling of struts
Bending of beams
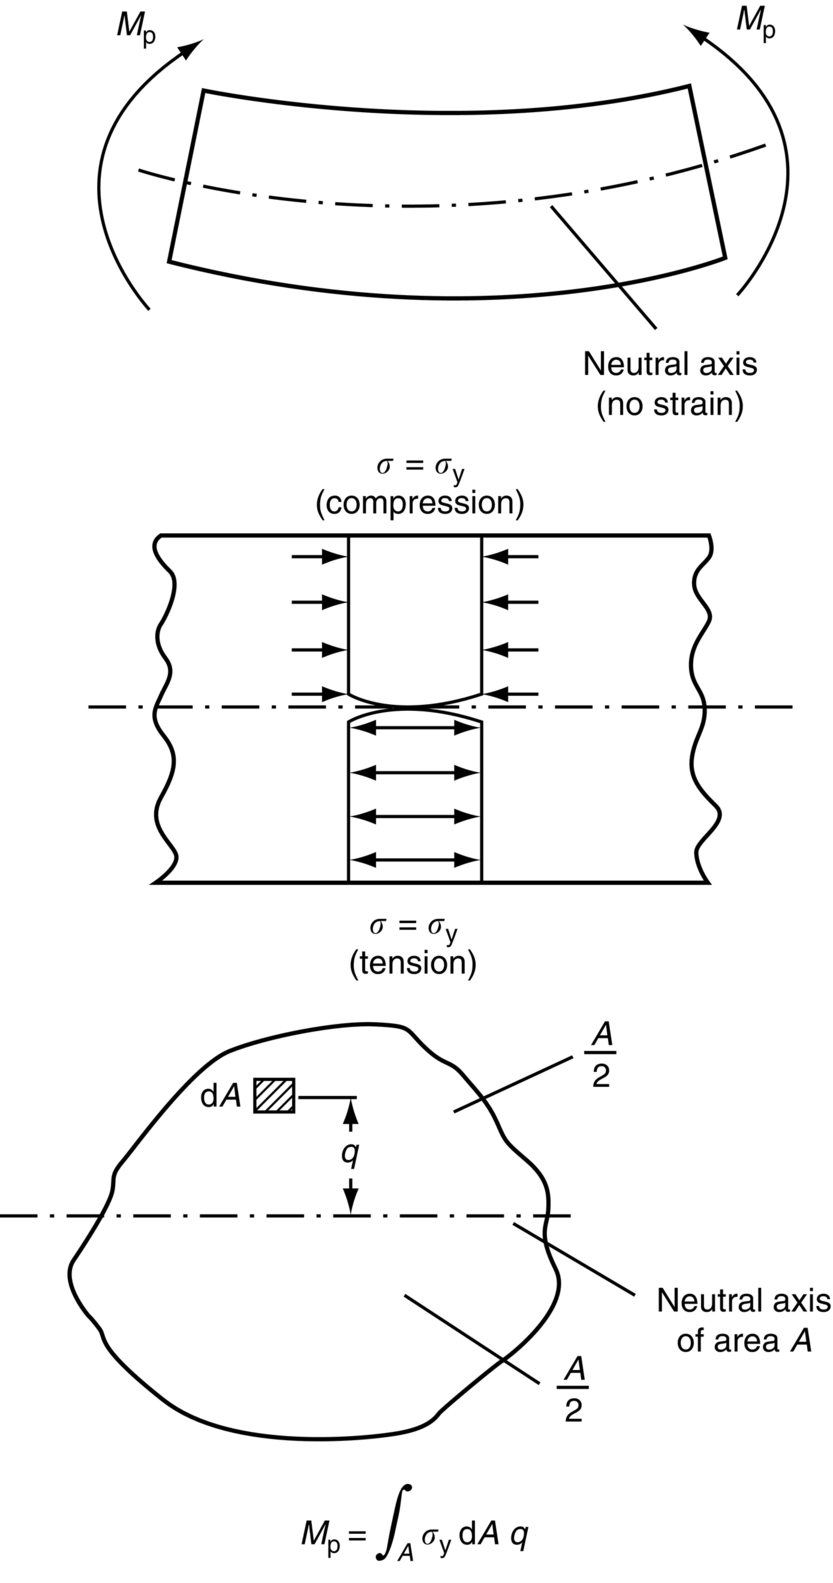
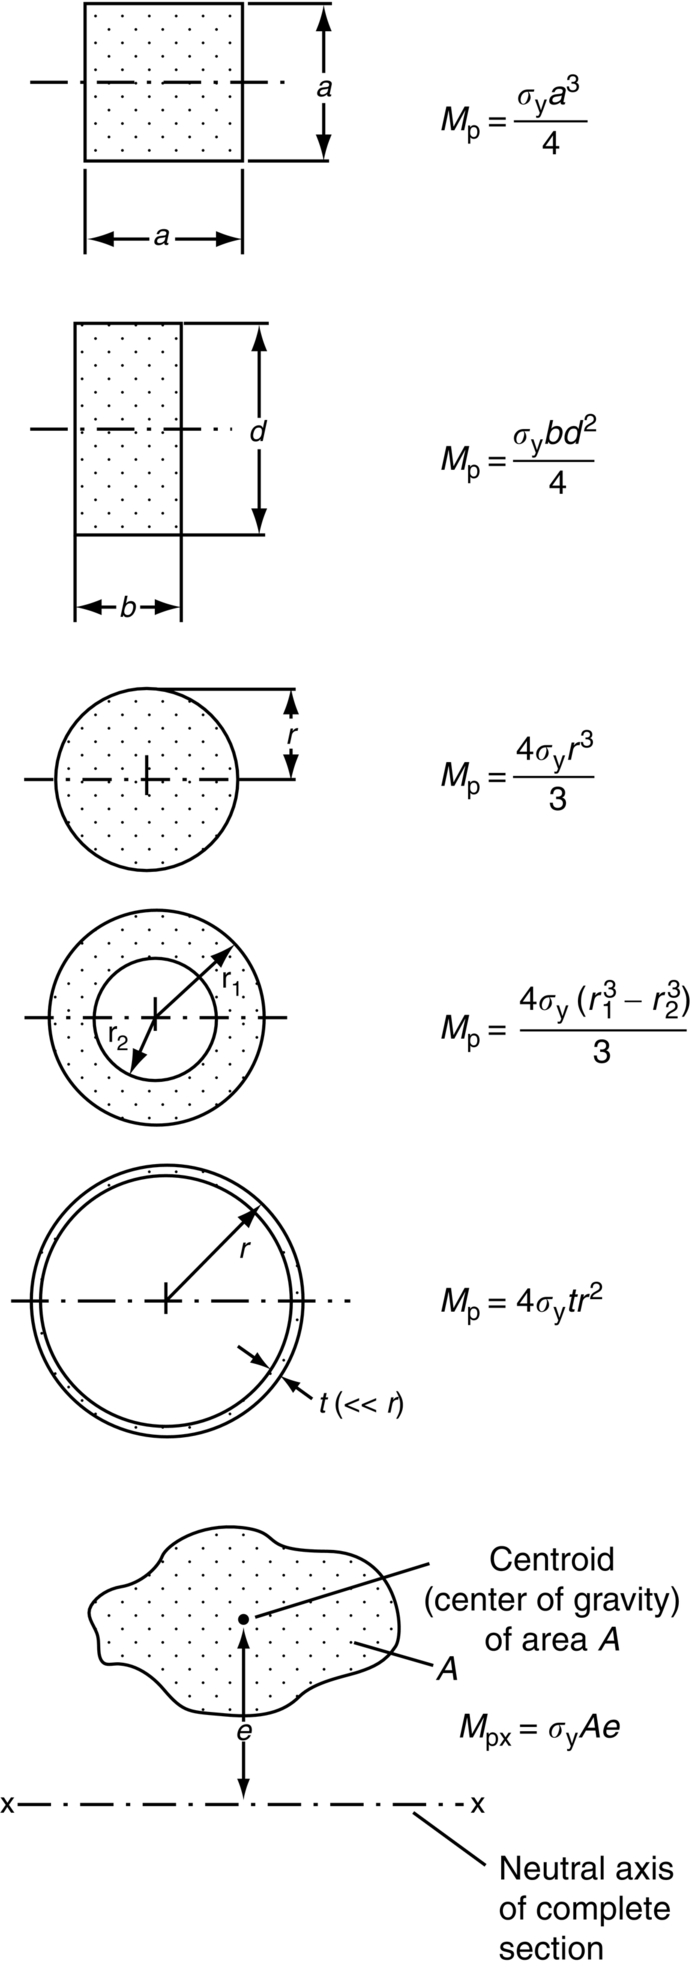
Plastic moments
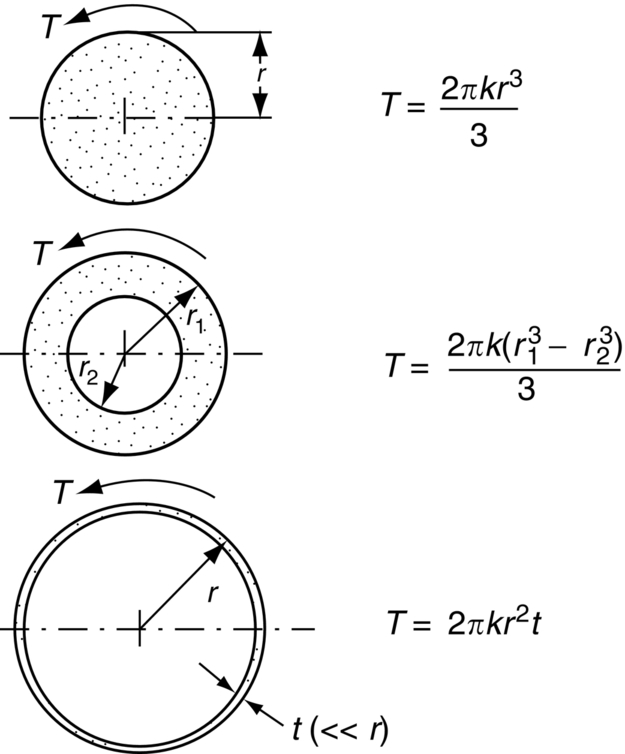
Shearing torques
Plastic buckling