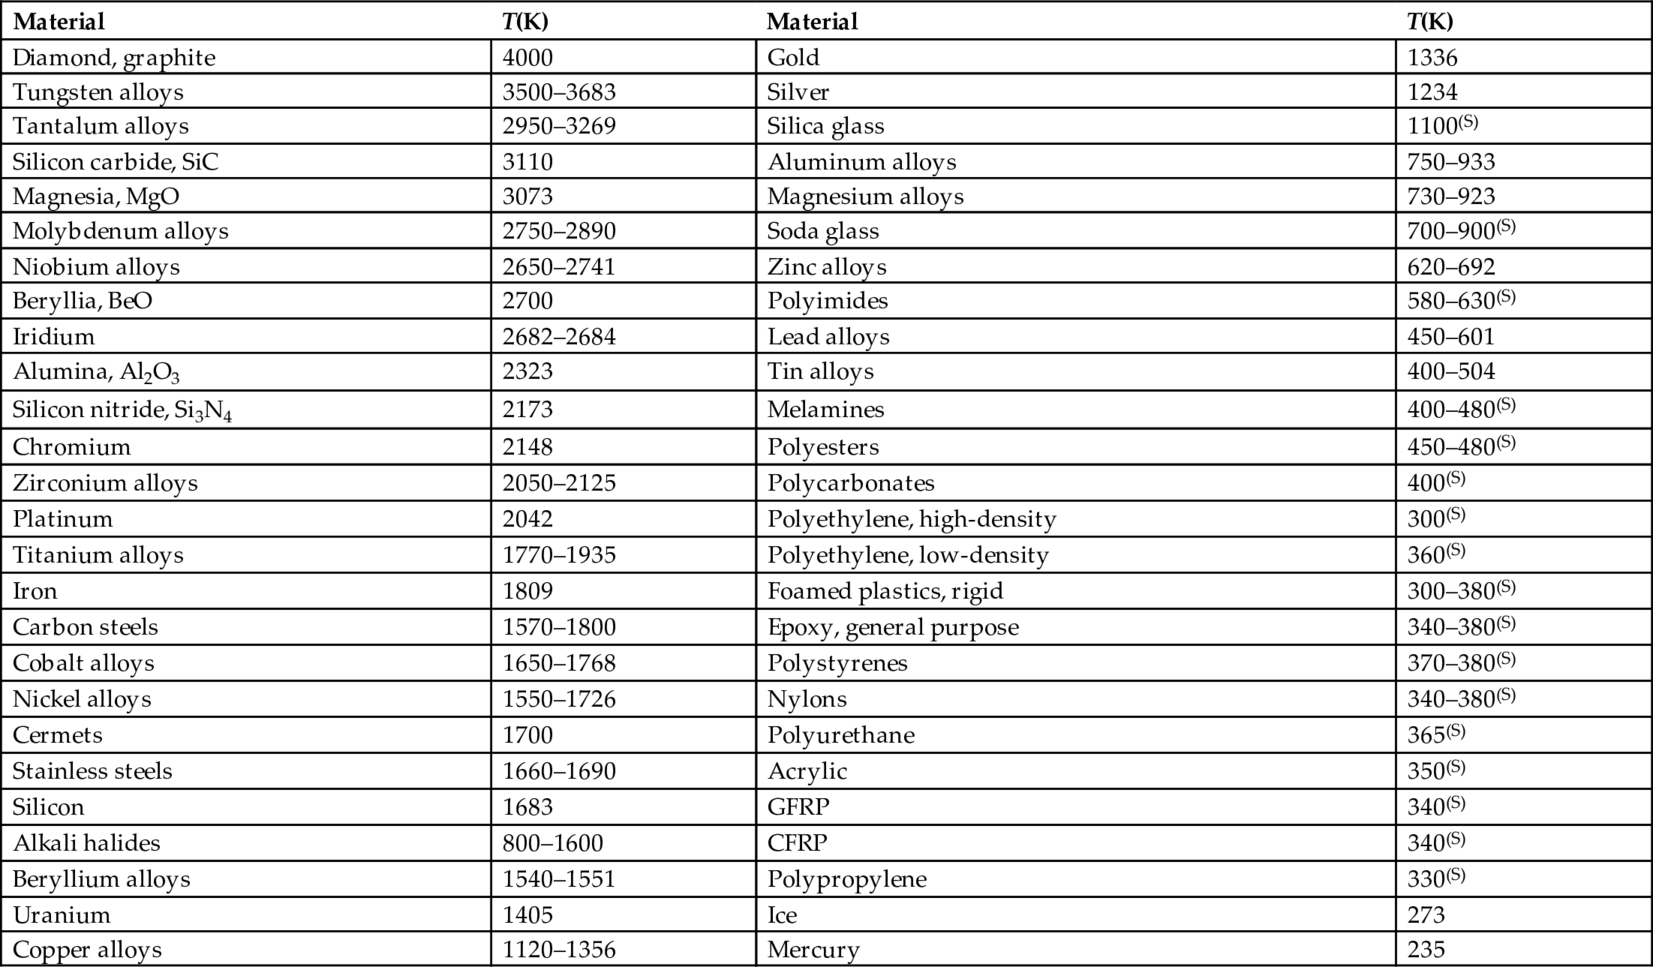
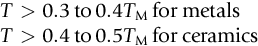
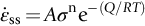
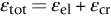
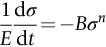
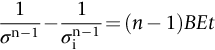
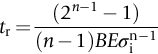
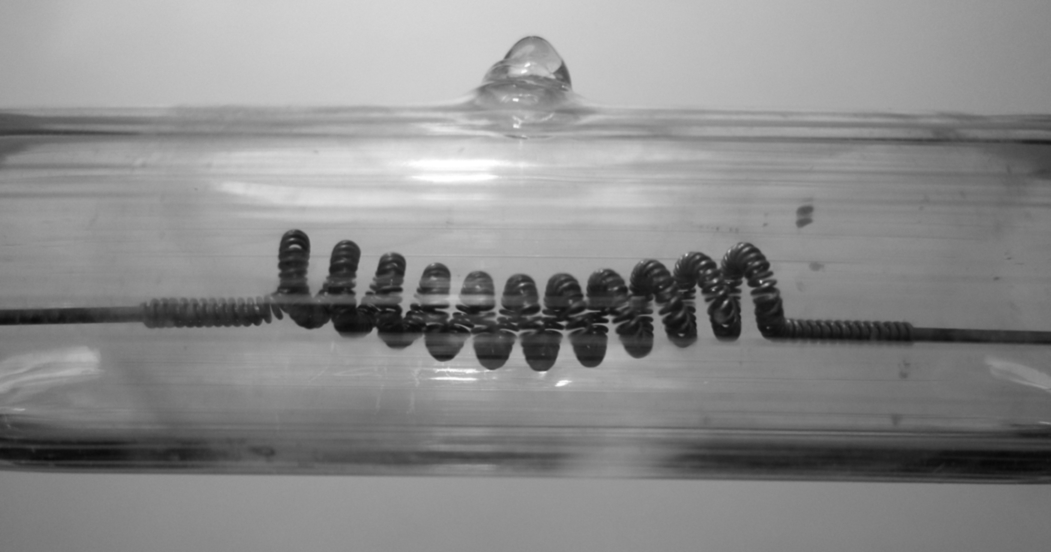
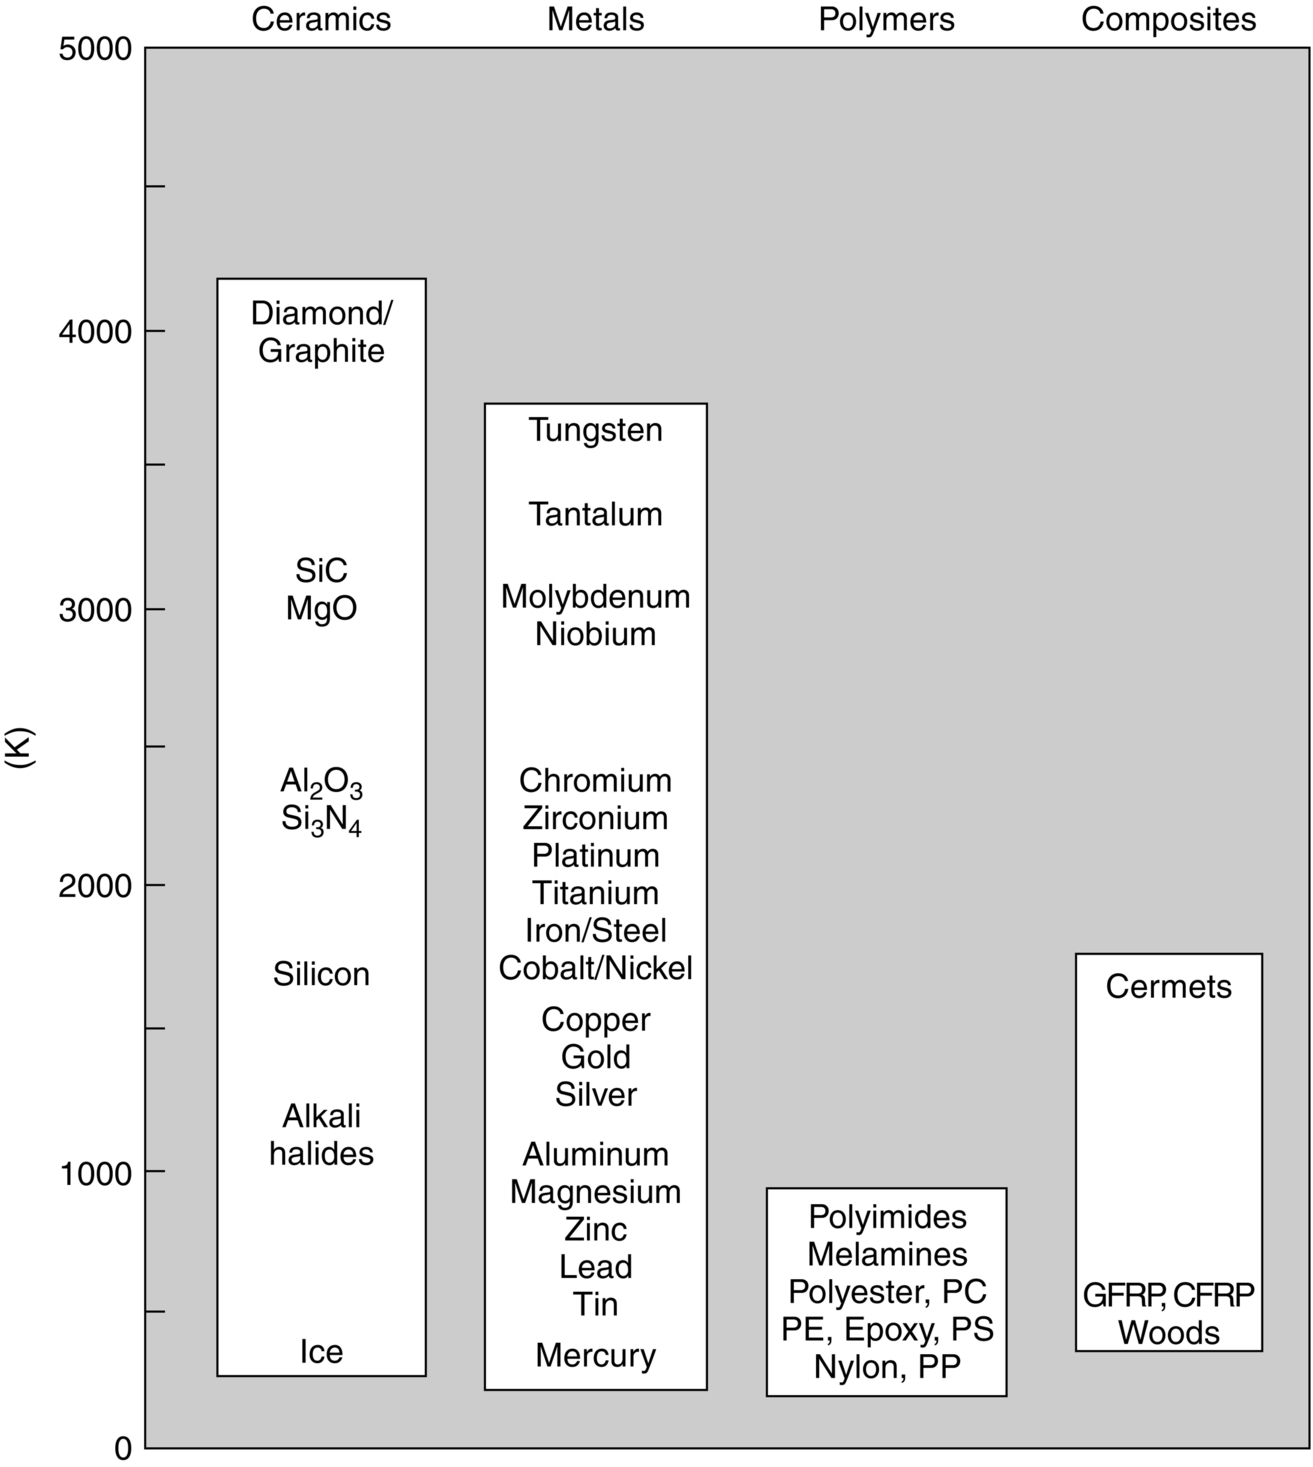
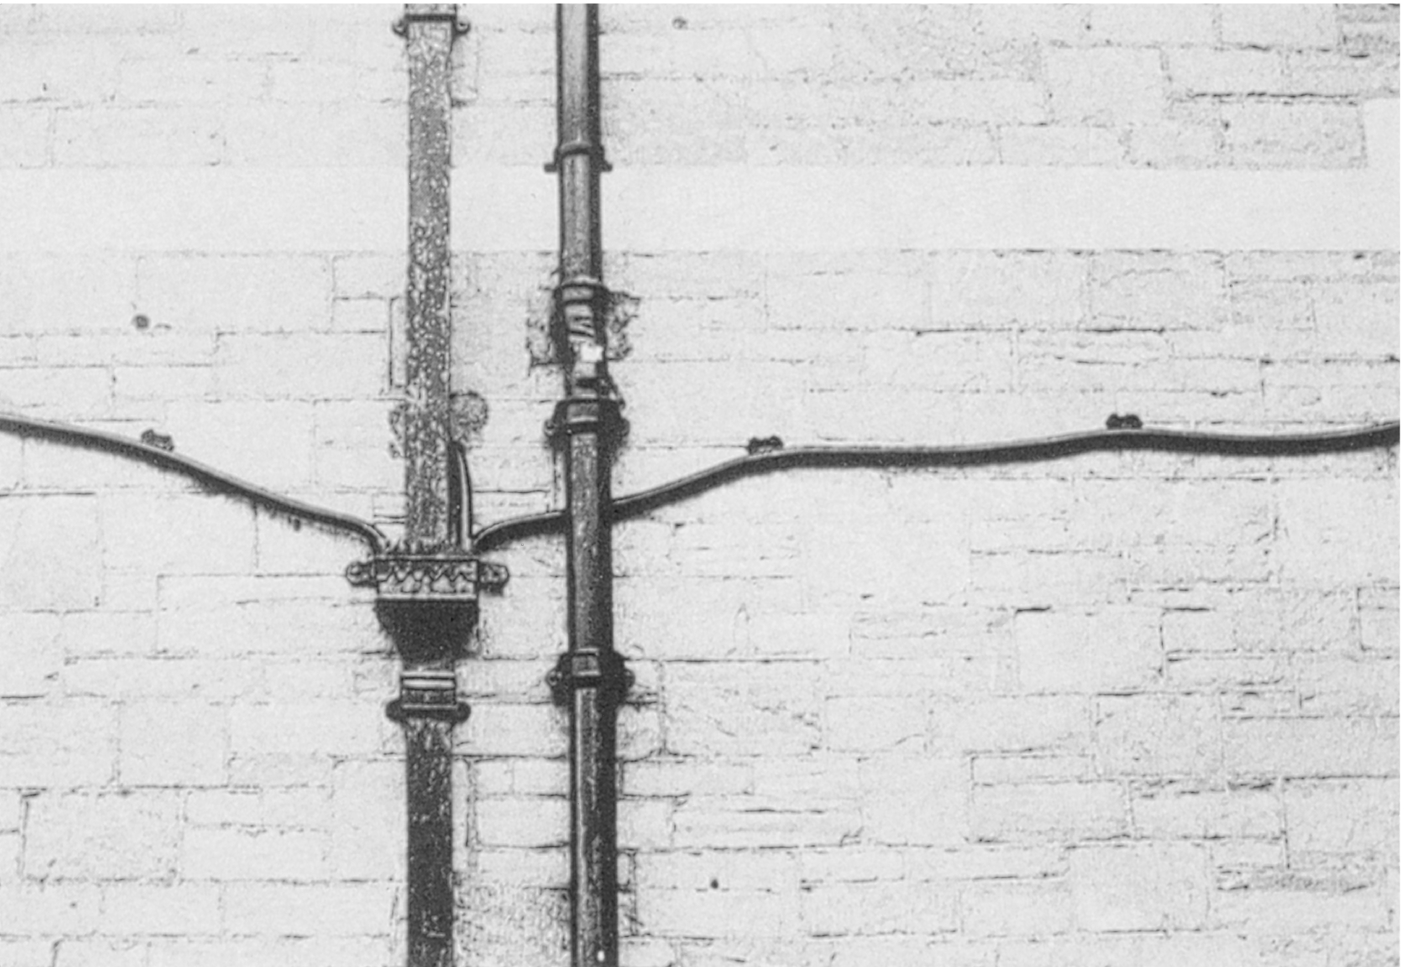
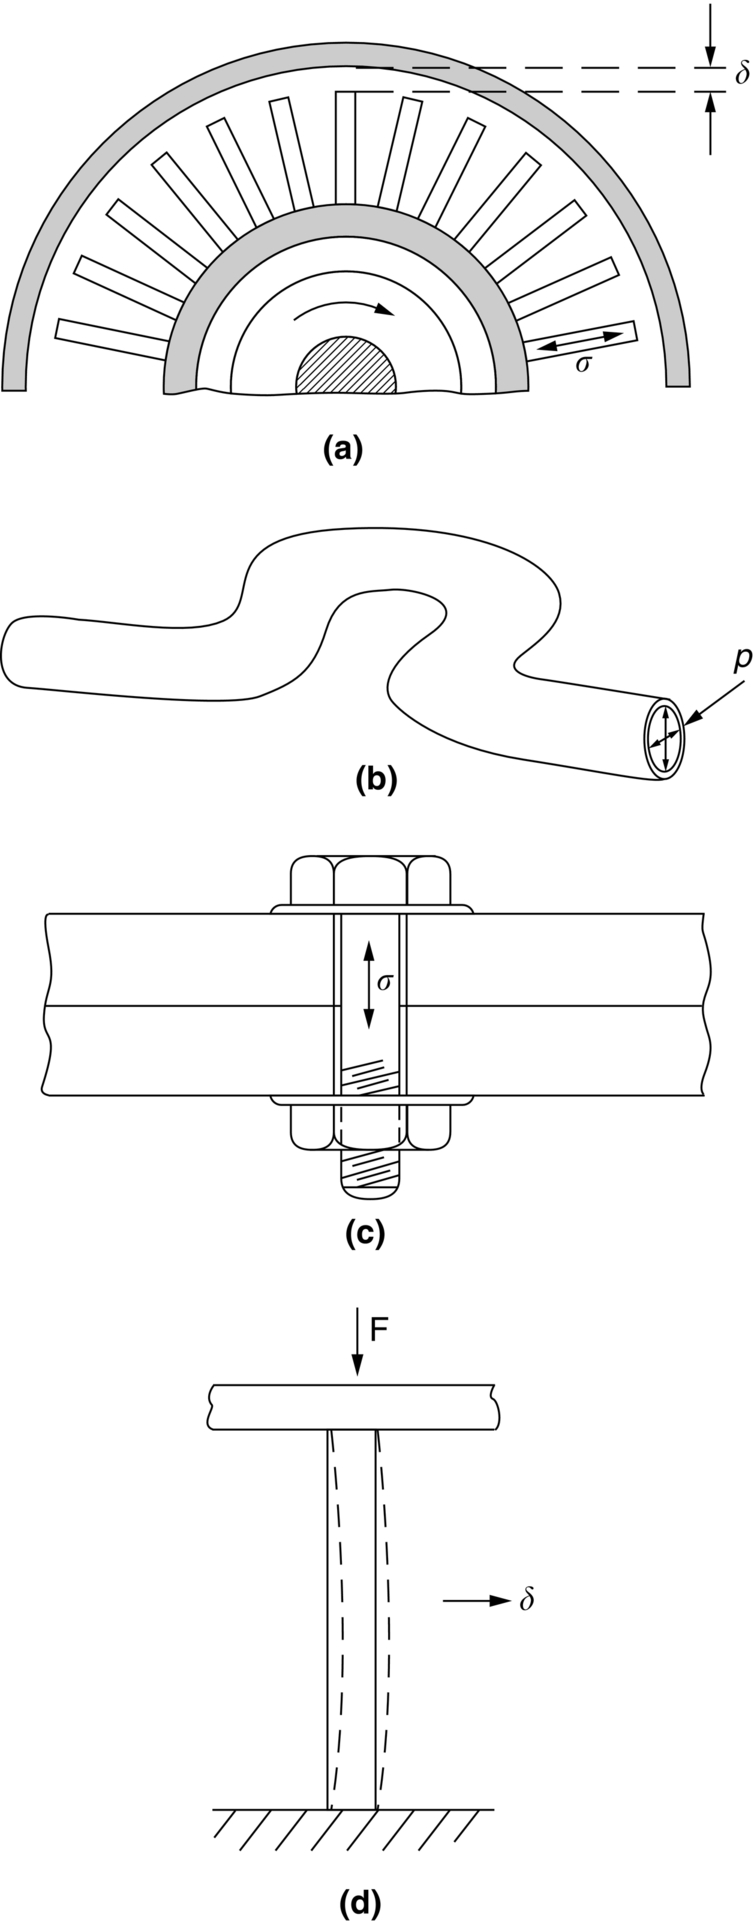
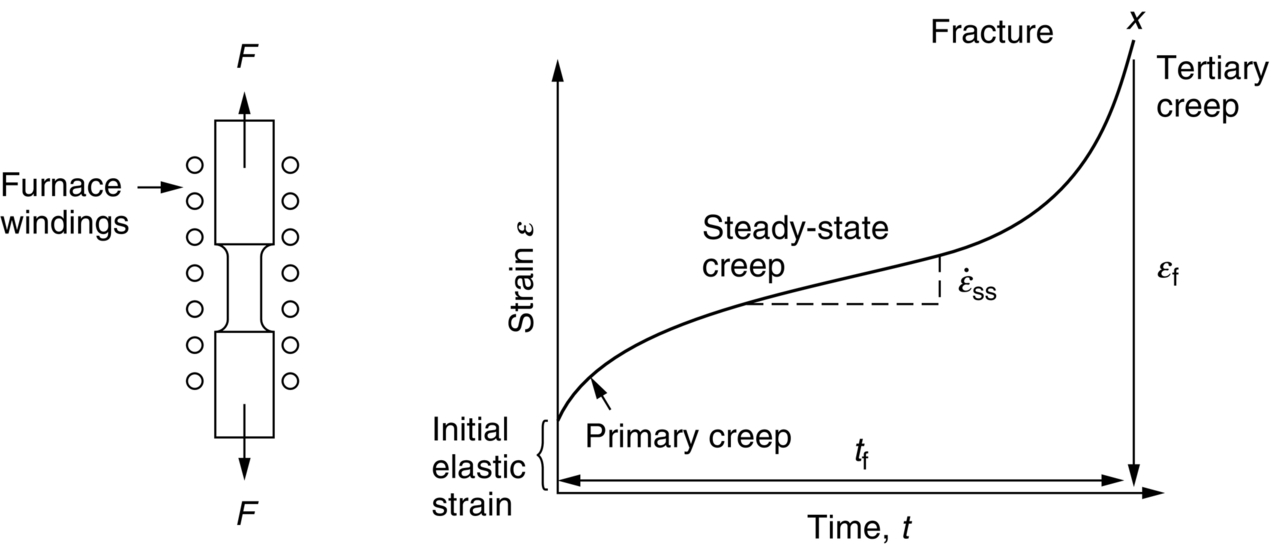
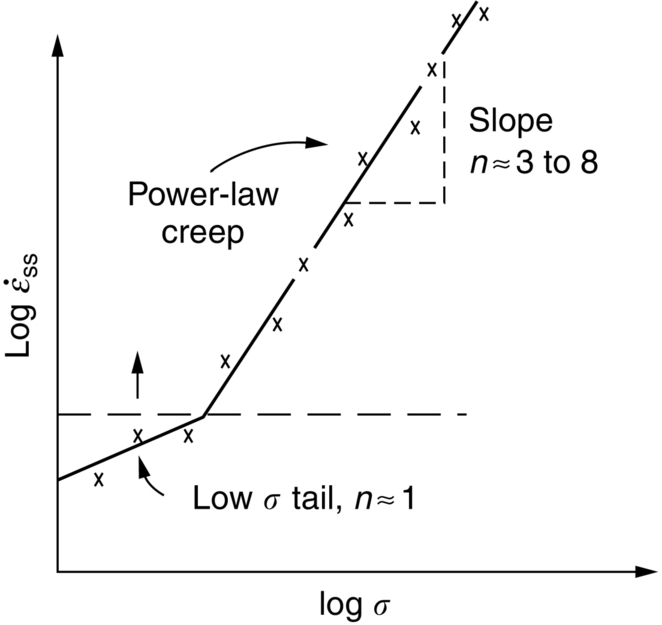
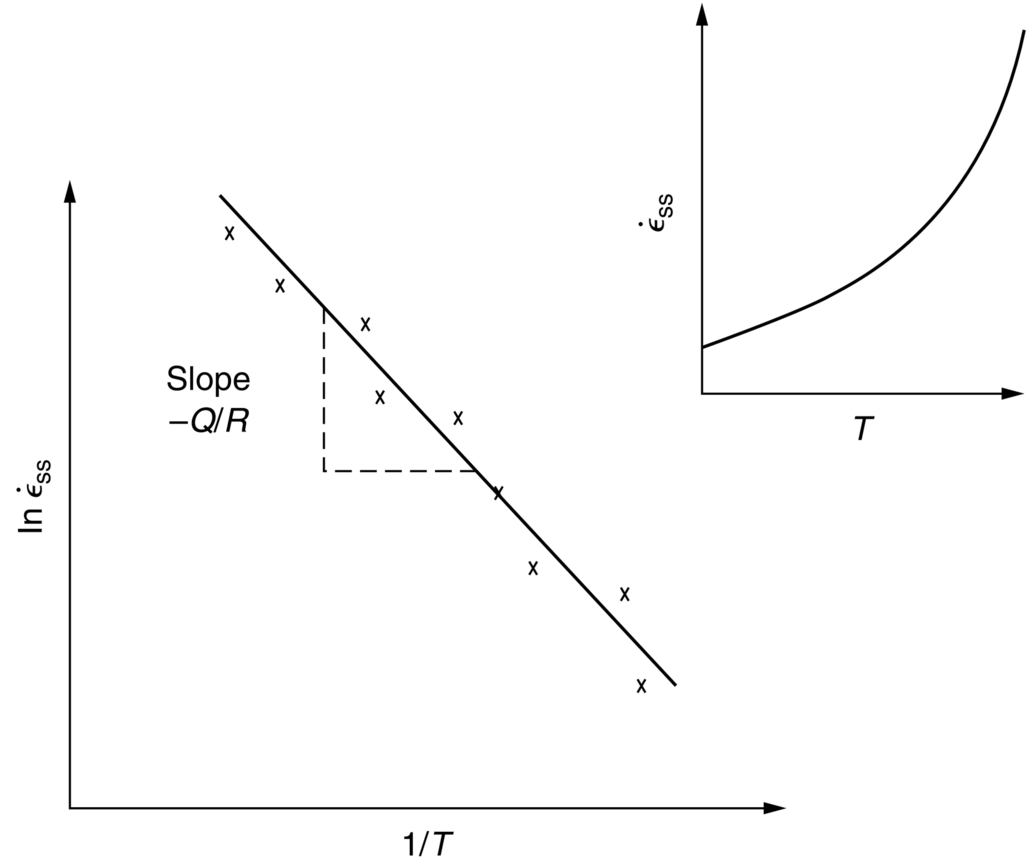
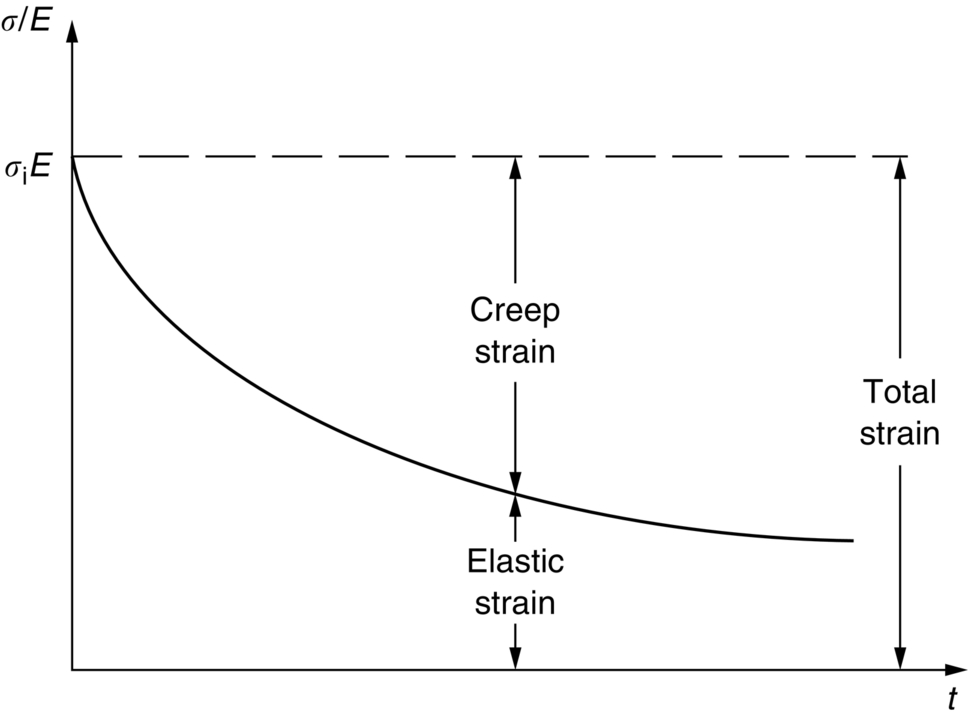
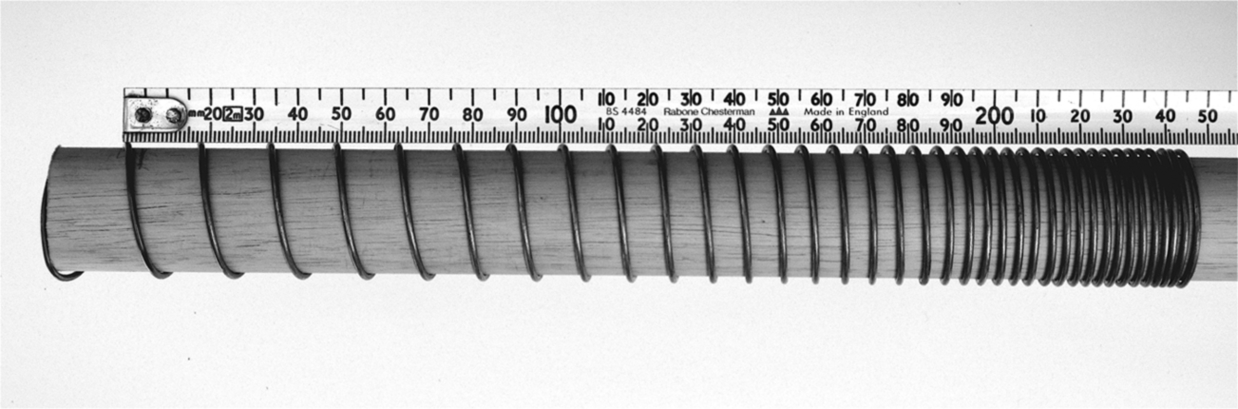
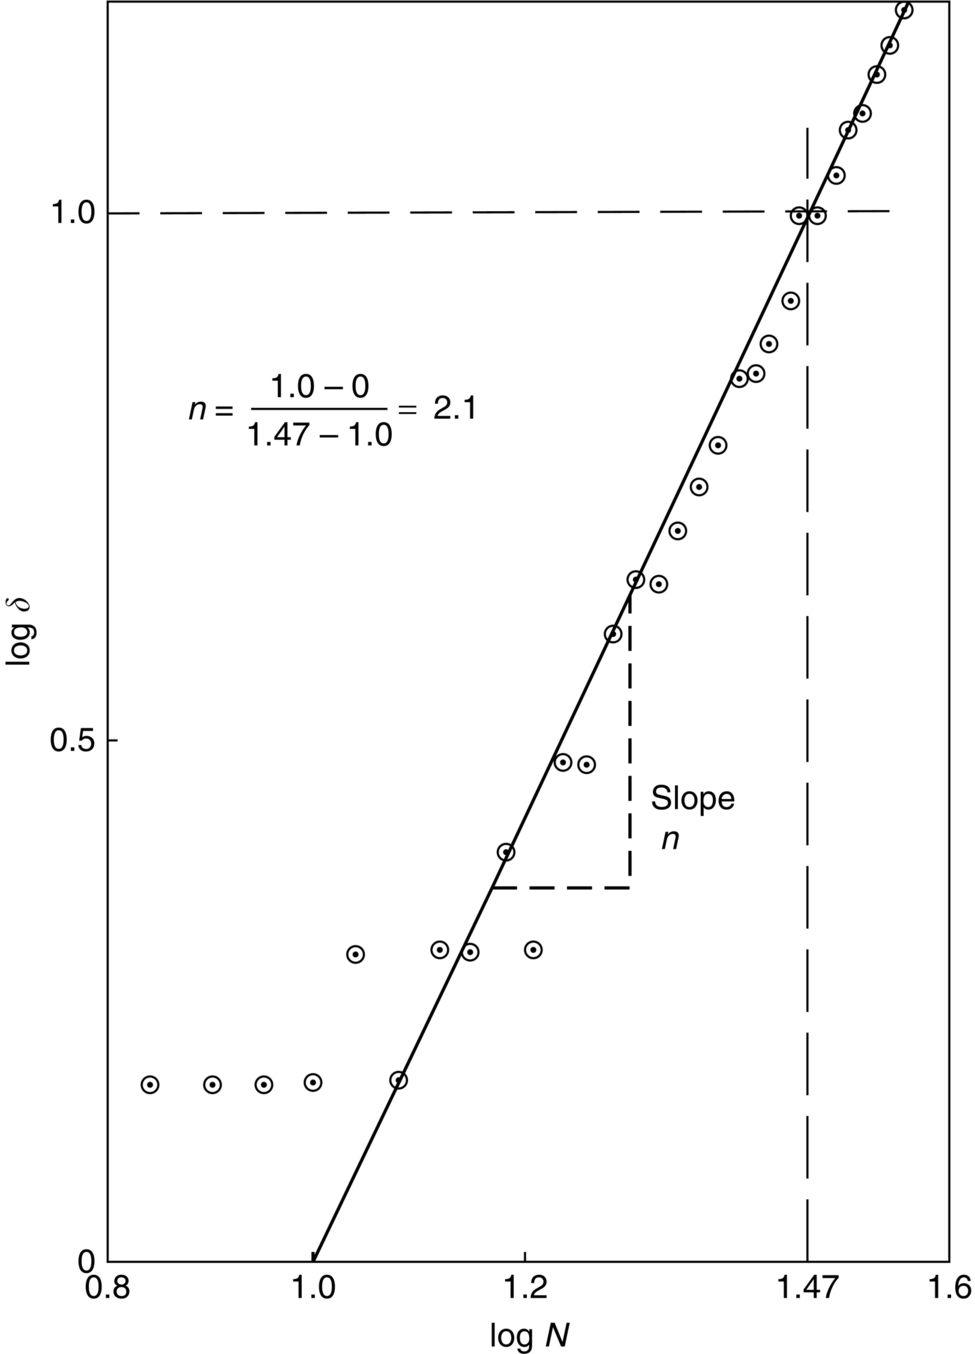
section epub:type=”chapter”> Many structures—particularly those that are associated with energy conversion (e.g., turbines, reactors, steam, and chemical plant)—operate at much higher temperatures. At room temperature, most metals and ceramics deform in a way that depends on stress but which, for practical purposes, is independent of time. As the temperature is raised, loads that give no permanent deformation at room temperature cause materials to creep. Creep is slow, continuous deformation with time: the strain, instead of depending only on the stress, then depends on temperature and time as well. Most metals and ceramics have high melting points and, because of this, they start to creep only at temperatures well above room temperature. In design against creep, those materials and the shape are selected that will carry the design loads, without failure, for the design life at the design temperature. The meaning of “failure” depends on the application. Creep tests require careful temperature control. The chapter concludes with a discussion of creep-resistant materials. So far we have concentrated on mechanical properties at room temperature. Many structures—particularly those that are associated with energy conversion (e.g., turbines, reactors, steam, and chemical plant)—operate at much higher temperatures. At room temperature, most metals and ceramics deform in a way that depends on stress but which, for practical purposes, is independent of time: As the temperature is raised, loads that give no permanent deformation at room temperature cause materials to creep. Creep is slow, continuous deformation with time: the strain, instead of depending only on the stress, now depends on temperature and time as well: It is common to refer to the former behavior as “low-temperature” behavior, and the latter as “high temperature.” But what is a “low” temperature and what is a “high” temperature? Tungsten, used for lamp filaments, has a very high melting point—well over 3000°C. Room temperature, for tungsten, is a very low temperature. If made hot enough, however, tungsten will creep—that is the reason that lamps ultimately burn out. Tungsten lamps run at about 2000°C—this, for tungsten, is a high temperature. If you examine a lamp filament that has failed, you will see that it has sagged under its own weight until the turns of the coil have touched—that is, it has deformed by creep. Figure 21.1 shows a typical example of a sagging filament. Figure 21.2 and Table 21.1 give melting points for metals and ceramics and softening temperatures for polymers. Most metals and ceramics have high melting points and, because of this, they start to creep only at temperatures well above room temperature—this is why creep is a less familiar phenomenon than elastic or plastic deformation. But the metal lead, for instance, has a melting point of 600 K; room temperature, 300 K, is exactly half its absolute melting point. Room temperature for lead is a high temperature, and it creeps—as Figure 21.3 shows. And the ceramic ice melts at 0°C. Temperate glaciers (those close to 0°C) are at a temperature at which ice creeps rapidly—that is why glaciers move. Even the thickness of the Antarctic ice cap, which controls the levels of the earth’s oceans, is determined by the creep spreading of the ice at about –30°C. The point, then, is that the temperature at which materials start to creep depends on their melting point. As a general rule, it is found that creep starts when where TM is the melting temperature in degrees kelvin. However, special alloying procedures can raise the temperature at which creep becomes a problem. Polymers, too, creep—many of them do so at room temperature. As we said in Chapter 5, most common polymers are not crystalline and have no well-defined melting point. For them, the important temperature is the glass temperature, TG, at which the Van der Waals bonds solidify. Above this temperature, the polymer is in a leathery or rubbery state and creeps rapidly under load. Below, it becomes hard (and sometimes brittle) and, for practical purposes, no longer creeps. TG is near room temperature for most polymers, so creep is a problem. In design against creep, we select the material and the shape that will carry the design loads, without failure, for the design life at the design temperature. The meaning of “failure” depends on the application. We distinguish four types of failure, illustrated in Figure 21.4. To analyze these we need constitutive equations which relate the strain-rate Creep tests require careful temperature control. Typically, a specimen is loaded in tension, usually at constant load, inside a furnace maintained at a constant temperature, T. The extension is measured as a function of time. Figure 21.5 shows a typical set of results from such a test. Metals, polymers, and ceramics all show creep curves of this shape. Although the initial elastic and the primary creep strain cannot be neglected, they occur quickly, and they can be treated in much the way that elastic deflection is allowed for in a structure. But thereafter, the material enters steady state, or secondary creep, and the strain increases steadily with time. In designing against creep, it is usually this steady accumulation of strain with time that concerns us most. By plotting the log of the steady creep rate, where n, the creep exponent, usually lies between 3 and 8. This sort of creep is called “power-law” creep. (At low σ, a different régime is entered where n ≈1; we shall discuss this low-stress deviation from power-law creep in Chapter 23.) By plotting the natural logarithm (ln) of Here R is the Universal Gas Constant (8.31 J mol−1 K−1) and Q is called the Activation Energy for Creep—it has units of J mol−1. Note that the creep rate increases exponentially with temperature (Figure 21.7). An increase in temperature of 20°C can double the creep rate. Combining these two dependences of where A is the creep constant. The values of the three constants A, n, and Q charactize the creep of a material; if you know these, you can calculate the strain rate at any temperature and stress by using the last equation. They vary from material to material, and have to be found experimentally. At constant displacement, creep causes stresses to relax with time. Bolts in hot turbine casings must be regularly tightened. Plastic paper clips are not, in the long-term, as good as steel ones because, even at room temperature, they slowly lose their grip. The relaxation time (arbitrarily defined as the time taken for the stress to relax to half its original value) can be calculated from the power-law creep data as follows. Consider a bolt that is tightened onto a rigid component so that the initial stress in its shank is σi. In this geometry (refer to Figure 21.4(c)) the length of the shank must remain constant—that is, the total strain in the shank ɛtot must remain constant. But creep strain ɛcr can replace elastic strain ɛel, causing the stress to relax. At any time t But and (at constant temperature) Since ɛtot is constant, we can differentiate Equation (21.4) with respect to time and substitute the other two equations into it to give Integrating from σ = σi at t = 0 to σ = σ at t = t gives Figure 21.8 shows how the initial elastic strain σi/E is slowly replaced by creep strain, and the stress in the bolt relaxes. If, as an example, it is a casing bolt in a large turbogenerator, it will have to be retightened at intervals to prevent steam leaking from the turbine. The time interval between retightening, tr, can be calculated by evaluating the time it takes for σ to fall to (say) one-half of its initial value. Setting σ = σi/2 and rearranging gives Experimental values for n, A, and Q for the material of the bolt thus enable us to decide how often the bolt will need retightening. Note that overtightening the bolt does not help because tr decreases rapidly as σi increases. During creep, damage accumulates in the form of internal cavities. The damage first appears at the start of the tertiary stage of the creep curve and grows at an increasing rate thereafter. The shape of the tertiary stage of the creep curve (refer to Figure 21.5) reflects this: as the cavities grow, the section of the sample decreases, and (at constant load) the stress goes up. Since It is not surprising—since creep causes creep fracture—that the time-to-failure, tf is described by a constitutive equation which looks very like that for creep itself: Here A′, m, and Q are the creep-failure constants, determined in the same way as those for creep (the exponents have the opposite sign because tf is a time whereas In many high-strength alloys this creep damage appears early in life and leads to failure after small creep strains (as little as 1%). In high-temperature design it is important to make sure: Times-to-failure are normally presented as creep-rupture diagrams (Figure 21.10). Their application is obvious: if you know the stress and temperature you can read off the life; if you wish to design for a certain life at a certain temperature, you can read off the design stress. From what we have said so far it should be obvious that the first requirement that we should look for in choosing materials that are resistant to creep is that they should have high melting (or softening) temperatures. If the material can then be used at less than 0.3 of its melting temperature creep will not be a problem. If it has to be used above this temperature, various alloying procedures can be used to increase creep resistance. To understand these, we need to know more about the mechanisms of creep—the subject of the next two chapters. The photograph on the next page shows an easy experiment you can rig up at home to demonstrate creep—and even measure the creep exponent, n. Take a length of wooden curtain pole or broom handle (mine was 28.5 mm diameter—1⅛”), and wrap electronic solder wire (mine was 1.60 mm diameter— You can see from the photograph that the coils have opened out much more at the top (where the wire supports the maximum load) than they have toward the bottom (where the wire supports a much smaller load). This tells you that the creep rate is increasing with stress, as it should do. But how fast does it increase? The value of the creep exponent n can easily be found as follows. Starting from the top of the coil, measure the positions of the crests of the wire (e.g., 1, 18, 34, 49, 63 mm). List the differences between these measurements which is the pitch of each turn (e.g., 17, 16, 15, 14 mm) and correlate these pitches with the number of turns of wire they support (e.g., 36, 35, 34, 33). The opening-out of each turn is found by subtracting the wire diameter (1.6 mm) from the pitch, giving 15.5, 14.5, 13.5, 12.5 mm, and so on (rounded to the nearest 0.5 mm). Then plot log (opening out) versus log (number of turns supported), e.g., log 15.5 versus log 36, log 14.5 versus log 35, etc. The full graph is shown in the following diagram. Over most of the range, there is an excellent fit to a straight line with a slope of 2.1, so n = 2.1. Only toward the bottom of the coil do the data points go off, but this is because it is very difficult to make accurate measurements of pitch from the photograph when the turns have opened out so little.
Creep and Creep Fracture
Publisher Summary
21.1 Introduction
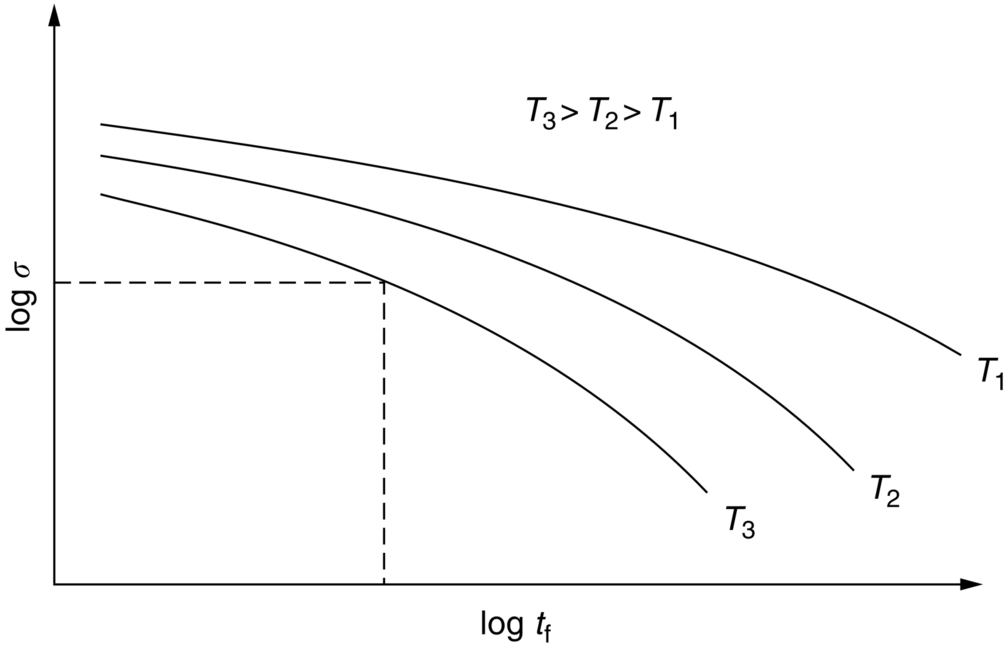
 or time-to-failure tf to the stress σ and temperature T.
21.2 Creep Testing and Creep Curves
 , against log σ at constant T, as shown in Figure 21.6, we can establish that
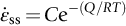
 against the reciprocal of the absolute temperature (1/T) at constant stress, as shown in Figure 21.7, we find that:
 gives
gives
21.3 Creep Relaxation
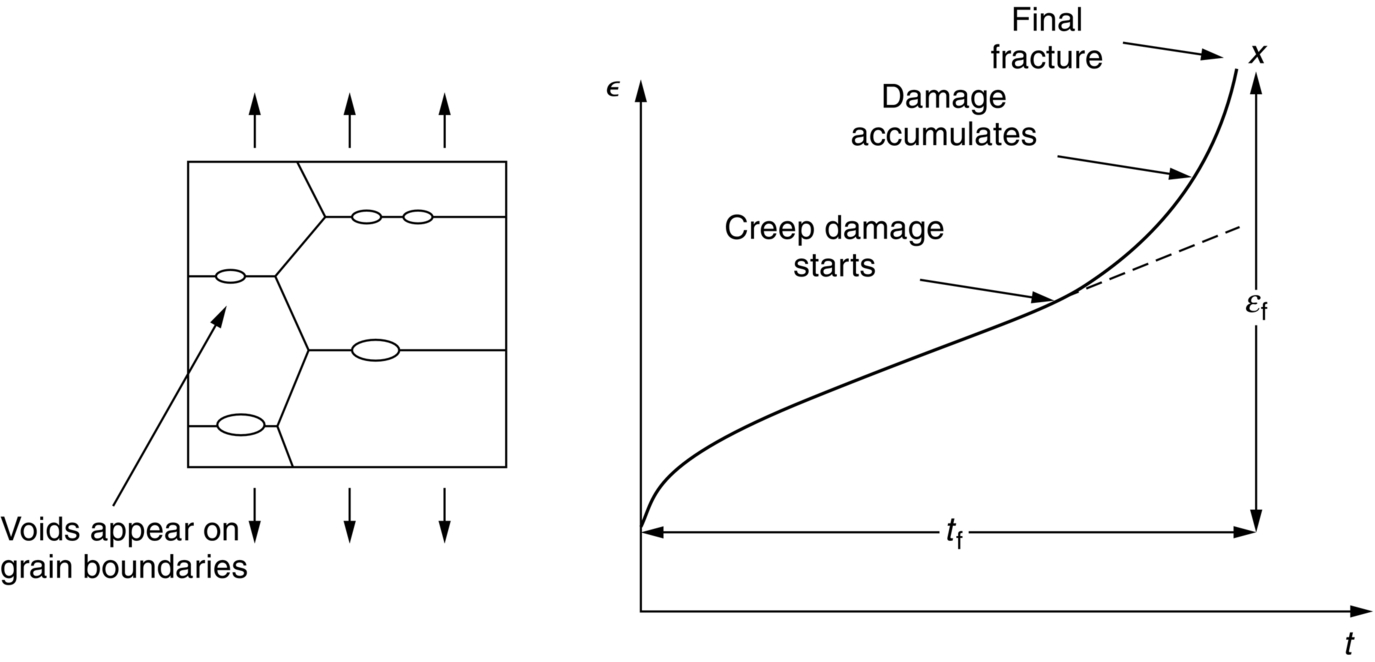
21.4 Creep Damage and Creep Fracture
 the creep rate goes up even faster than the stress does (Figure 21.9).
 is a rate).
 (strain to failure) is adequate to cope with the acceptable creep strain
21.5 Creep-Resistant Materials
Worked Example
 ”) around the pole to make a coil that has no gaps between the turns. I wound 36 turns of wire on to the pole. Then hook the end of the coil over the end of the pole as shown, and put the axis of the pole vertical (hold the lower end in a vice or clamp). Do the experiment indoors in the warm, and within a few minutes the coil will start to open out. After about 15 minutes it will look like the one in the photograph. Obviously the solder (an alloy of lead and tin) has experienced considerable creep deformation. This is exactly what you would expect—electronic solder melts at 183°C (456 K), so a room temperature of 20°C (293 K) is 0.64 TM—well into the régime where creep will occur.
Examples
Answers
(note Aσ 5 is now a constant), writing it out twice, and subtracting
to give  = 15.5 × 10⁻¹² s−1. When putting numbers into this equation, it is critical to input temperatures in K, and to input Q values in J mol−1 (not kJ mol−1). This is because R = 8.314 J mol−1 K−1, and Q/RT must be dimensionless (it is an exponent).
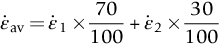
(iii) Work out the average creep rate, from
This gives an average creep rate of 6.82 × 10⁻¹² s−1.