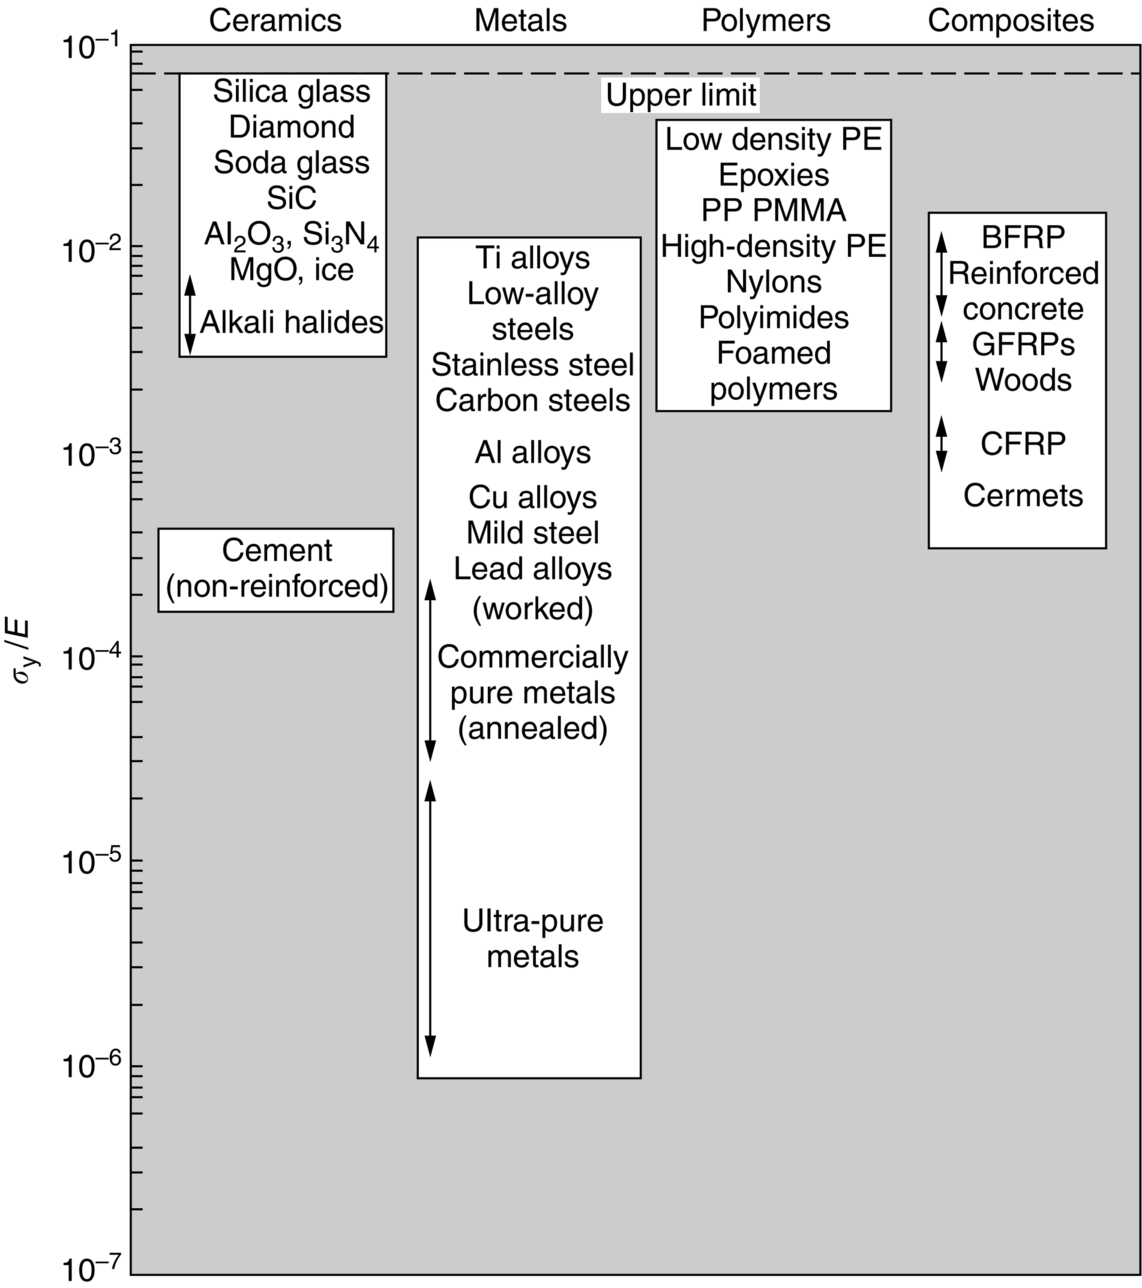
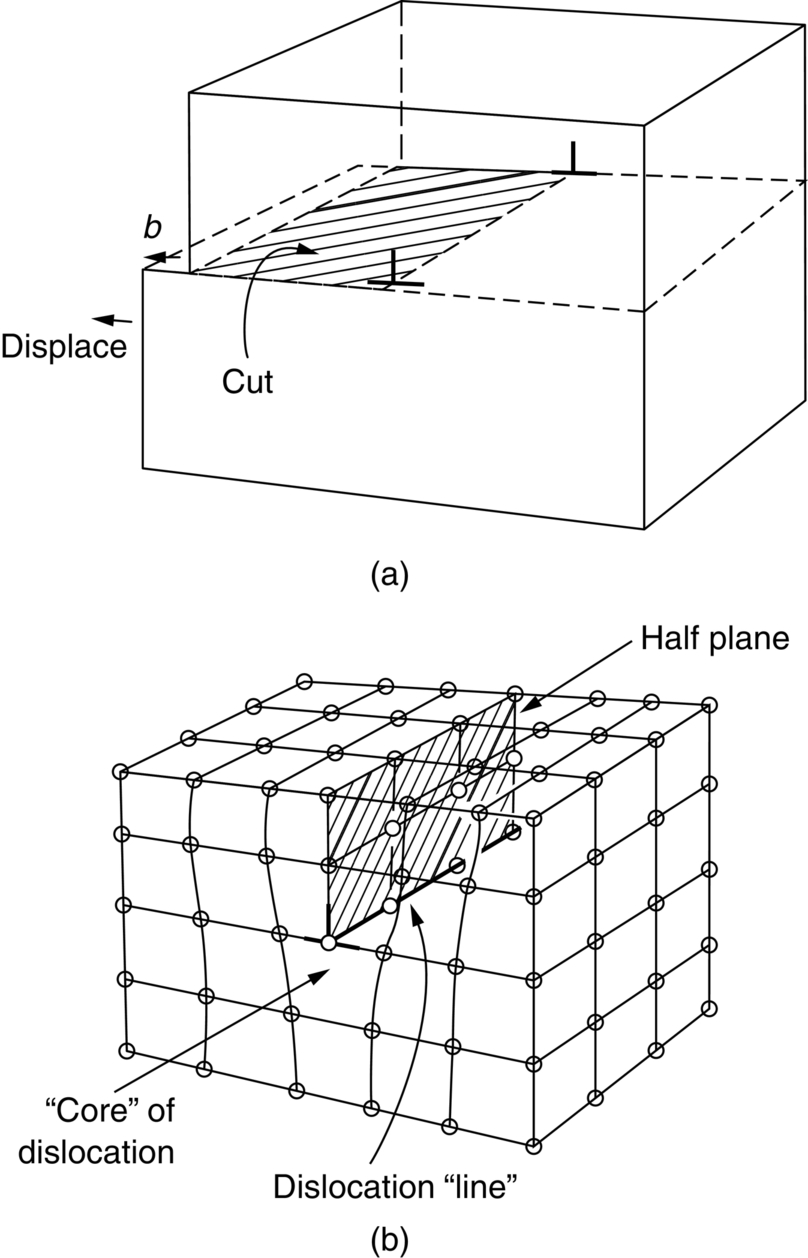
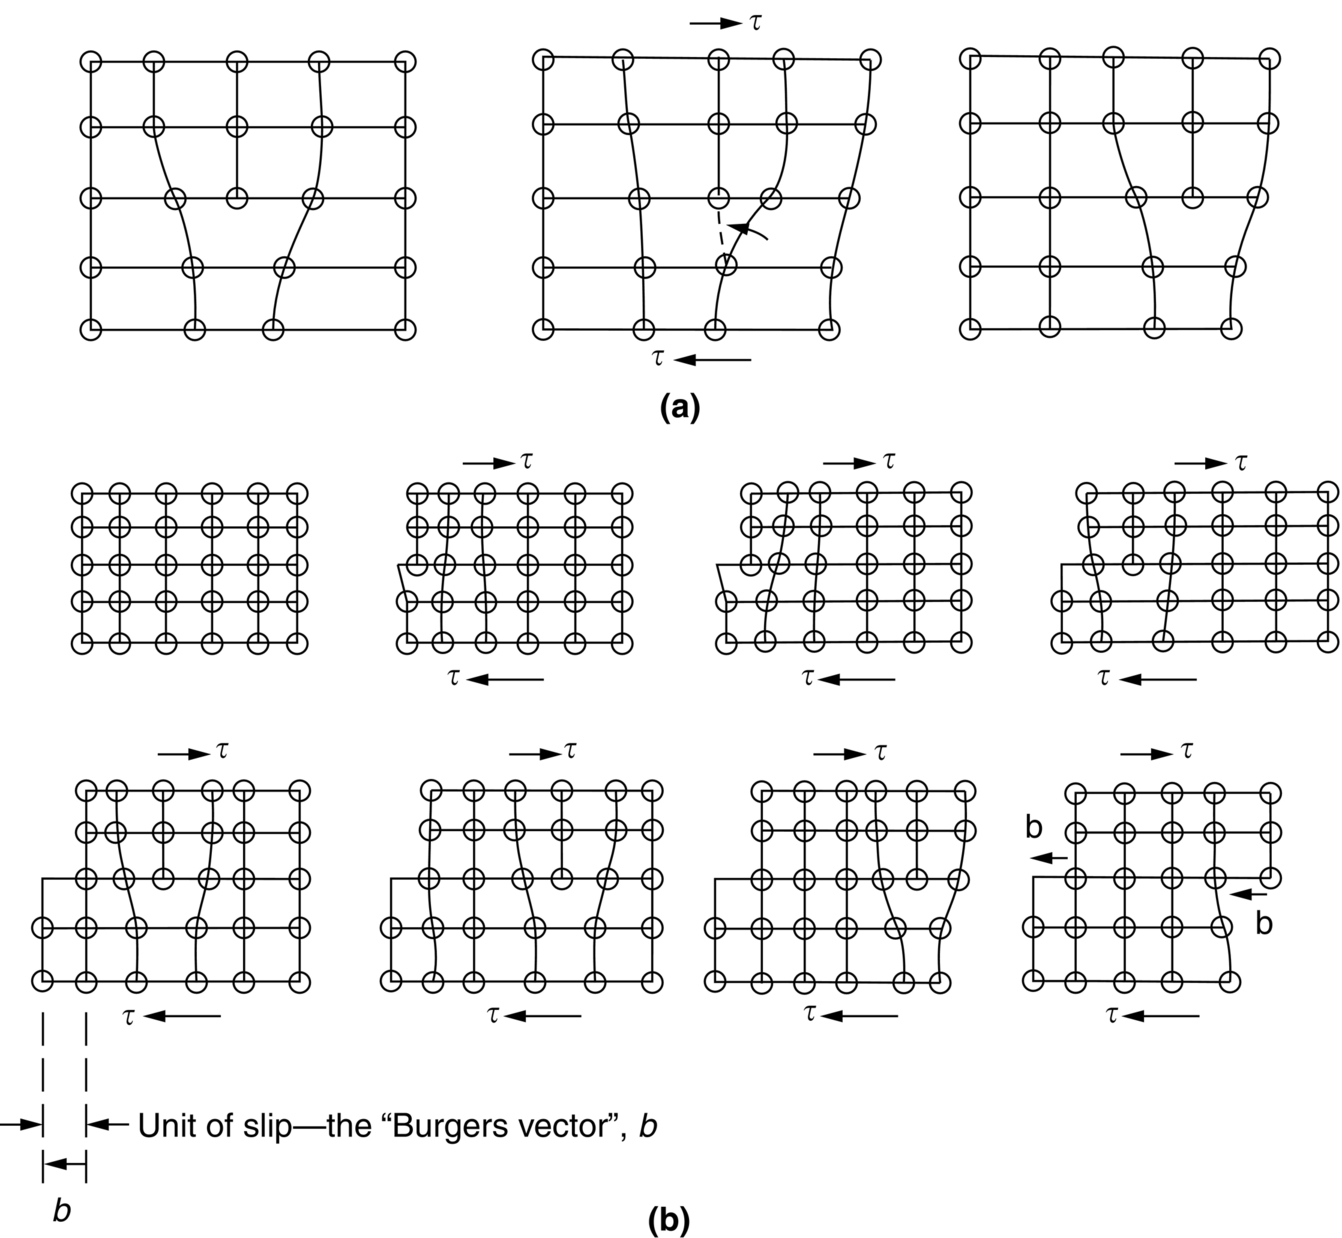
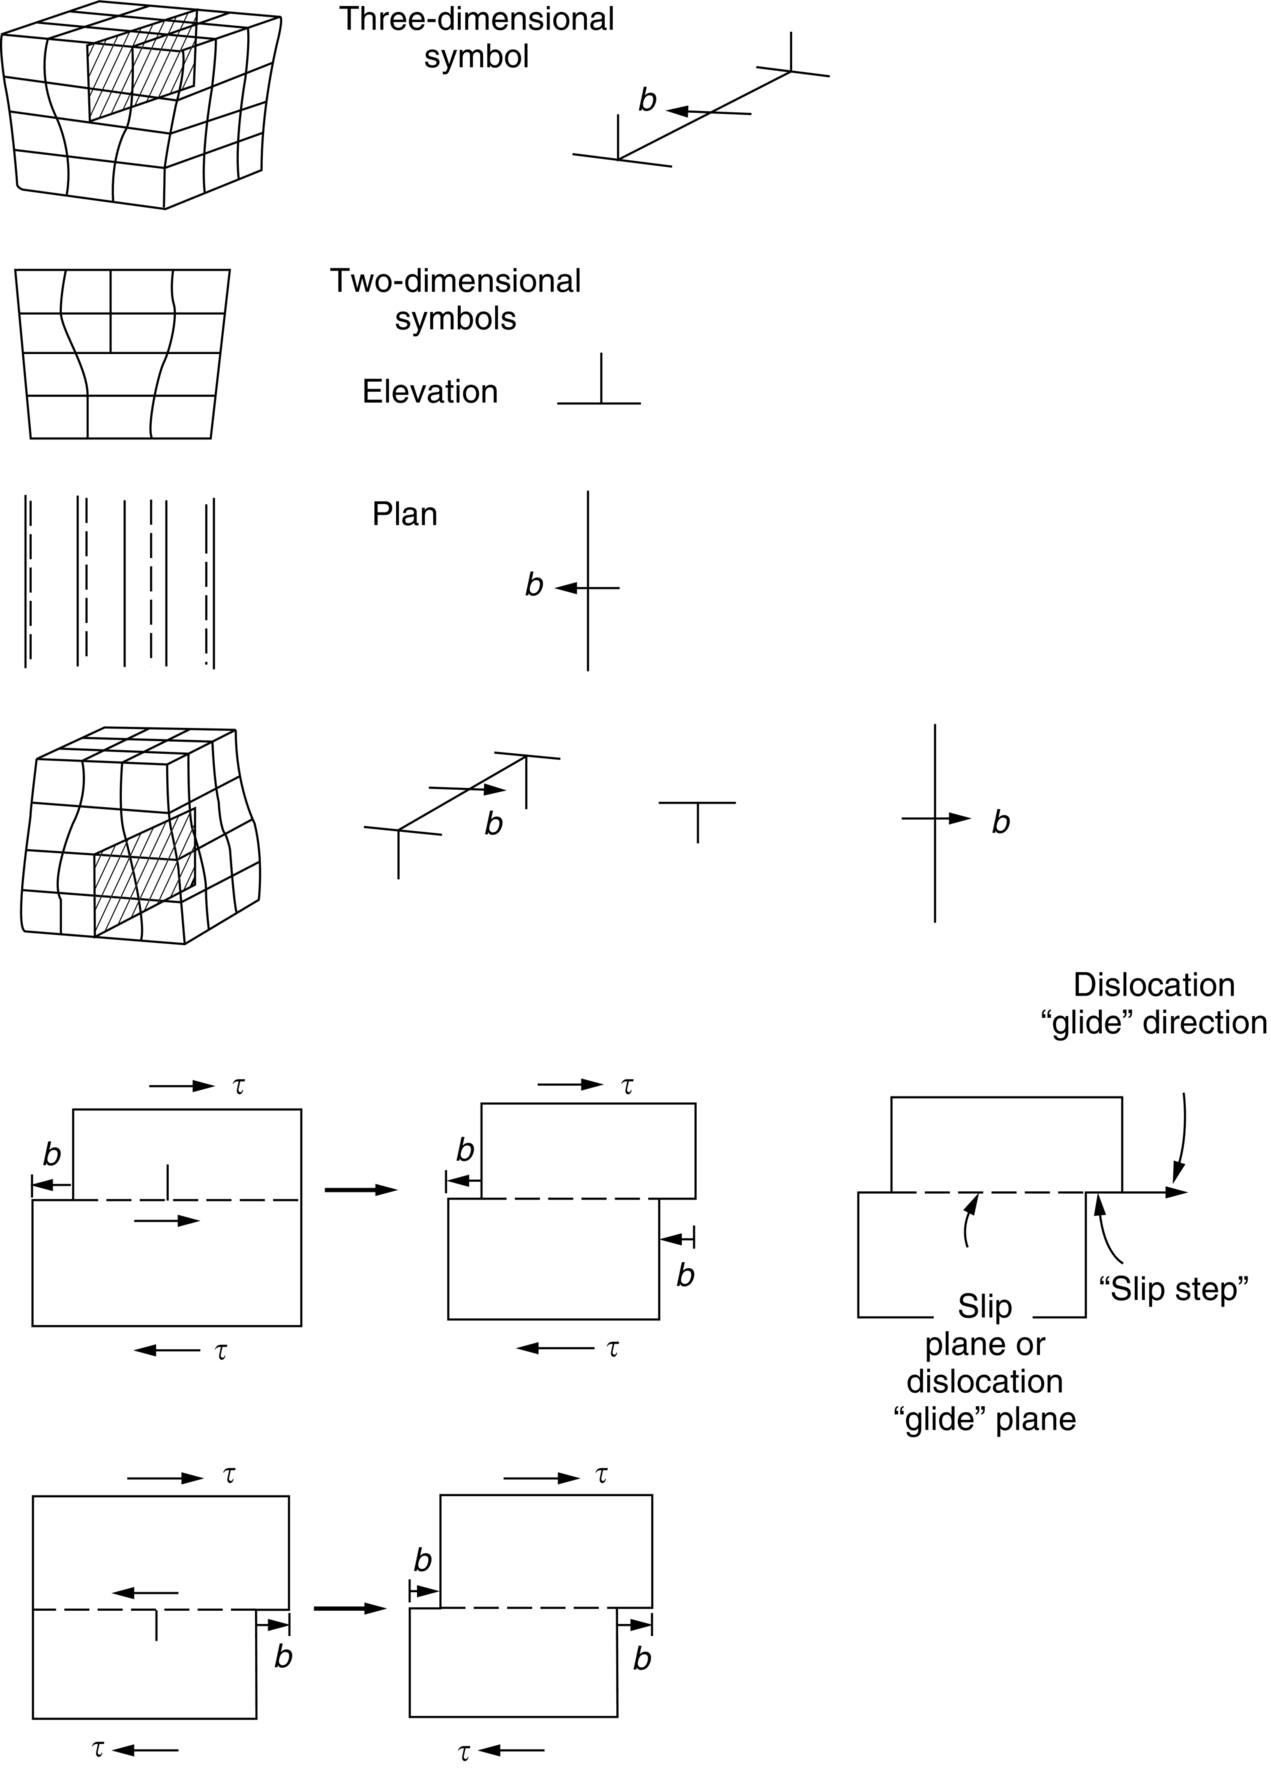
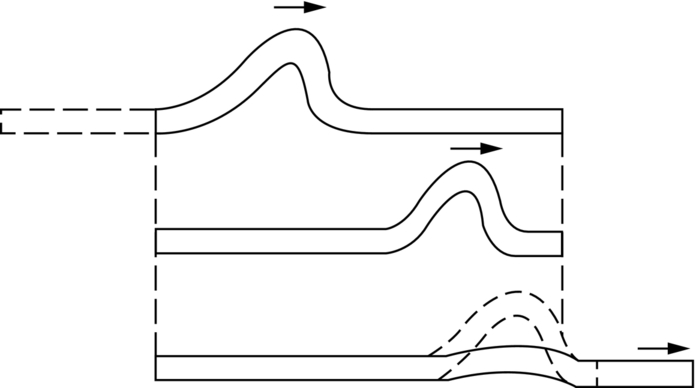
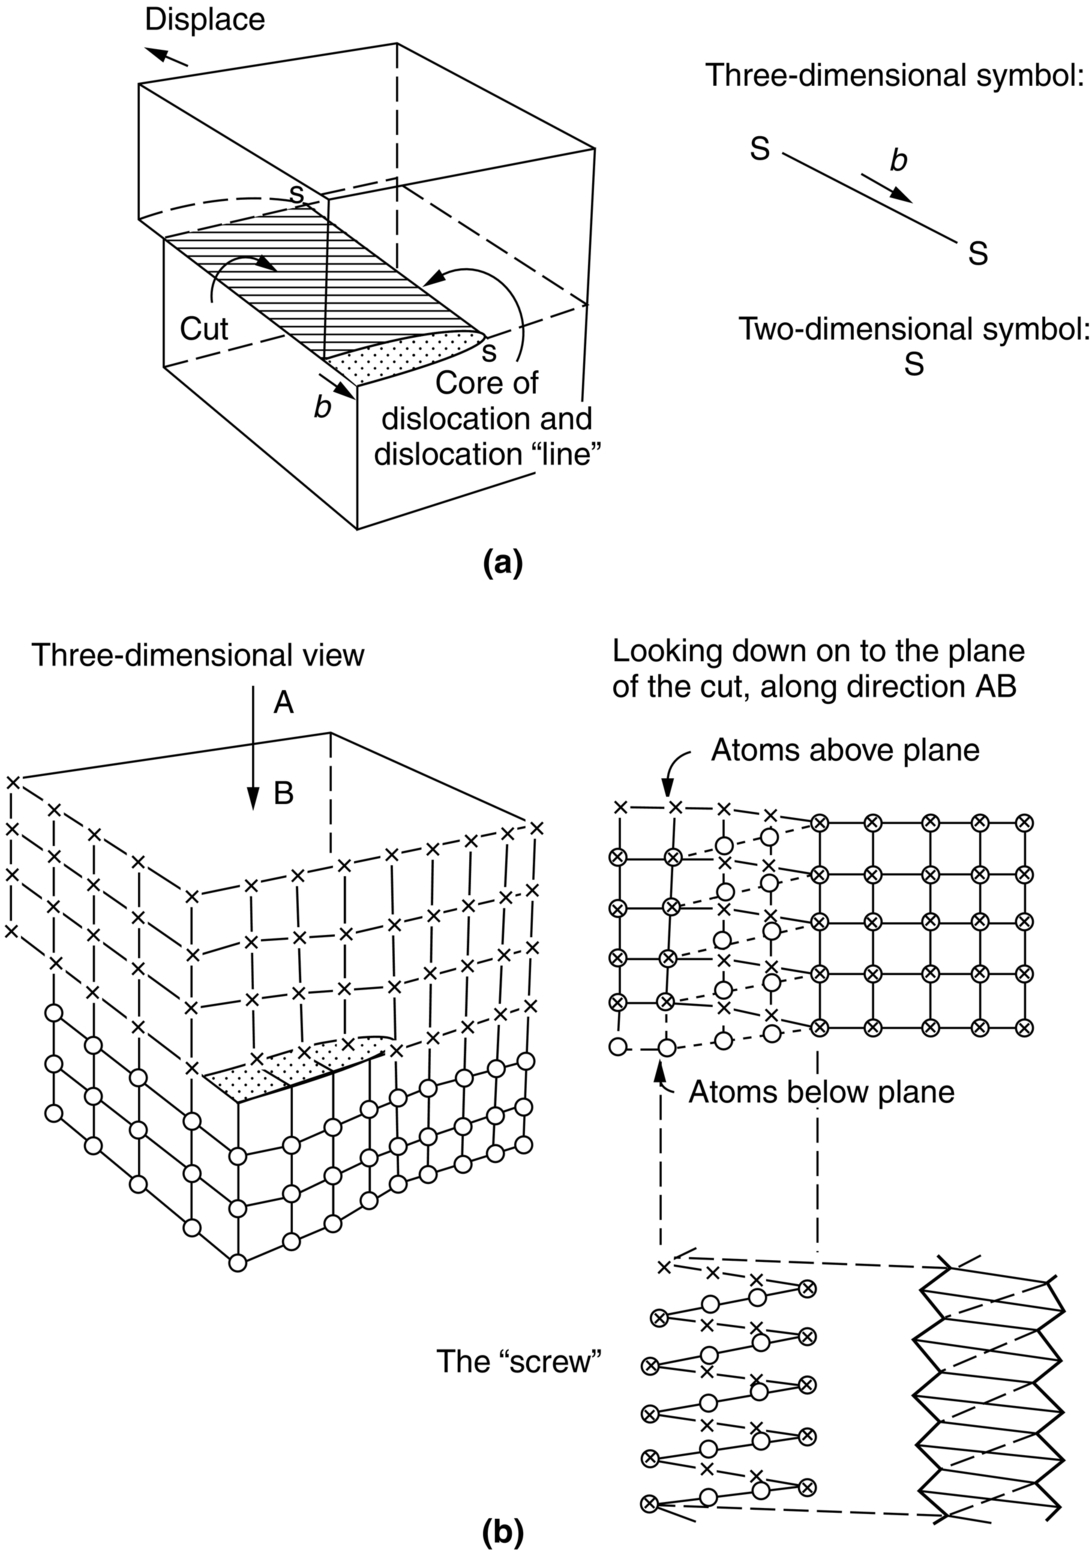
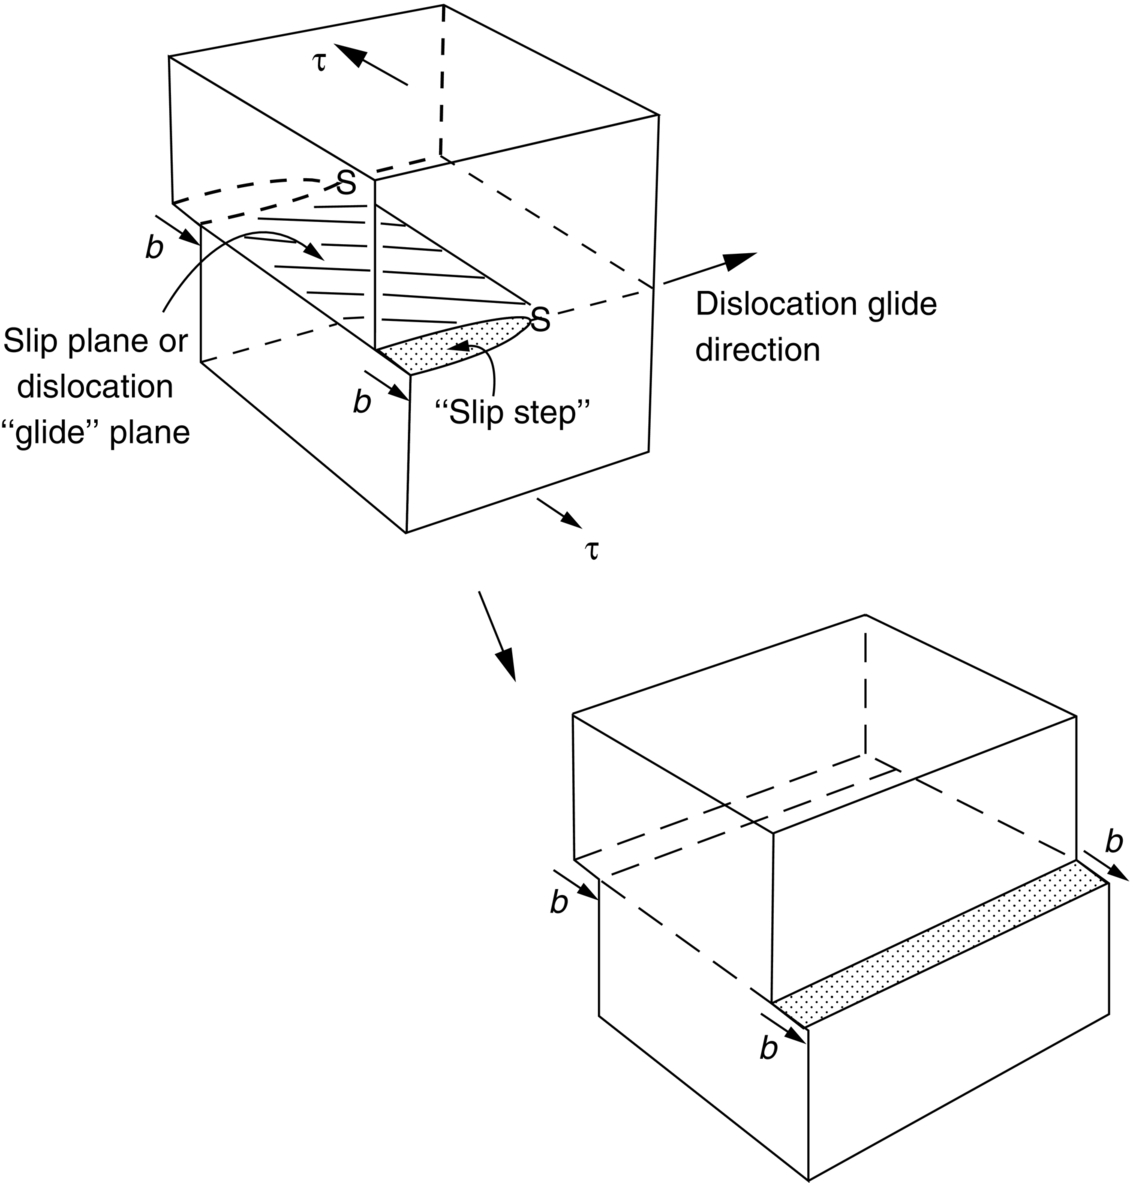
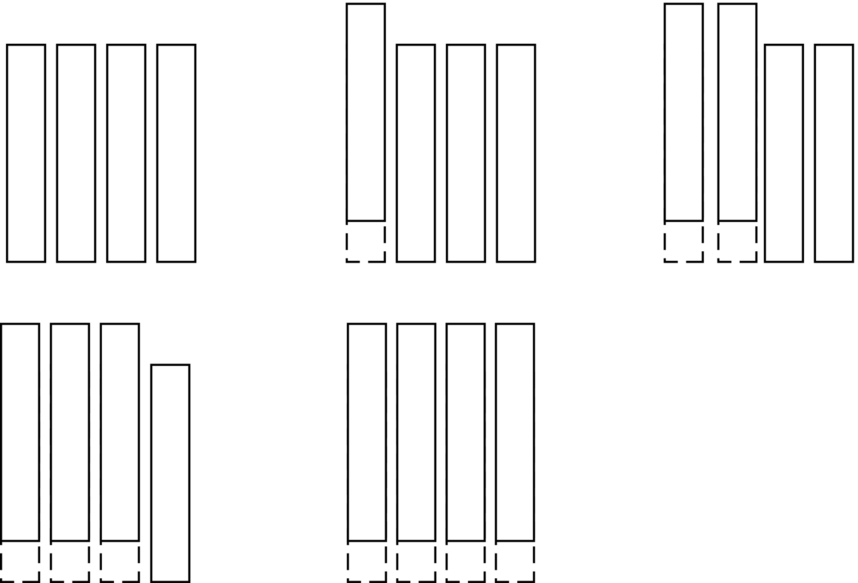
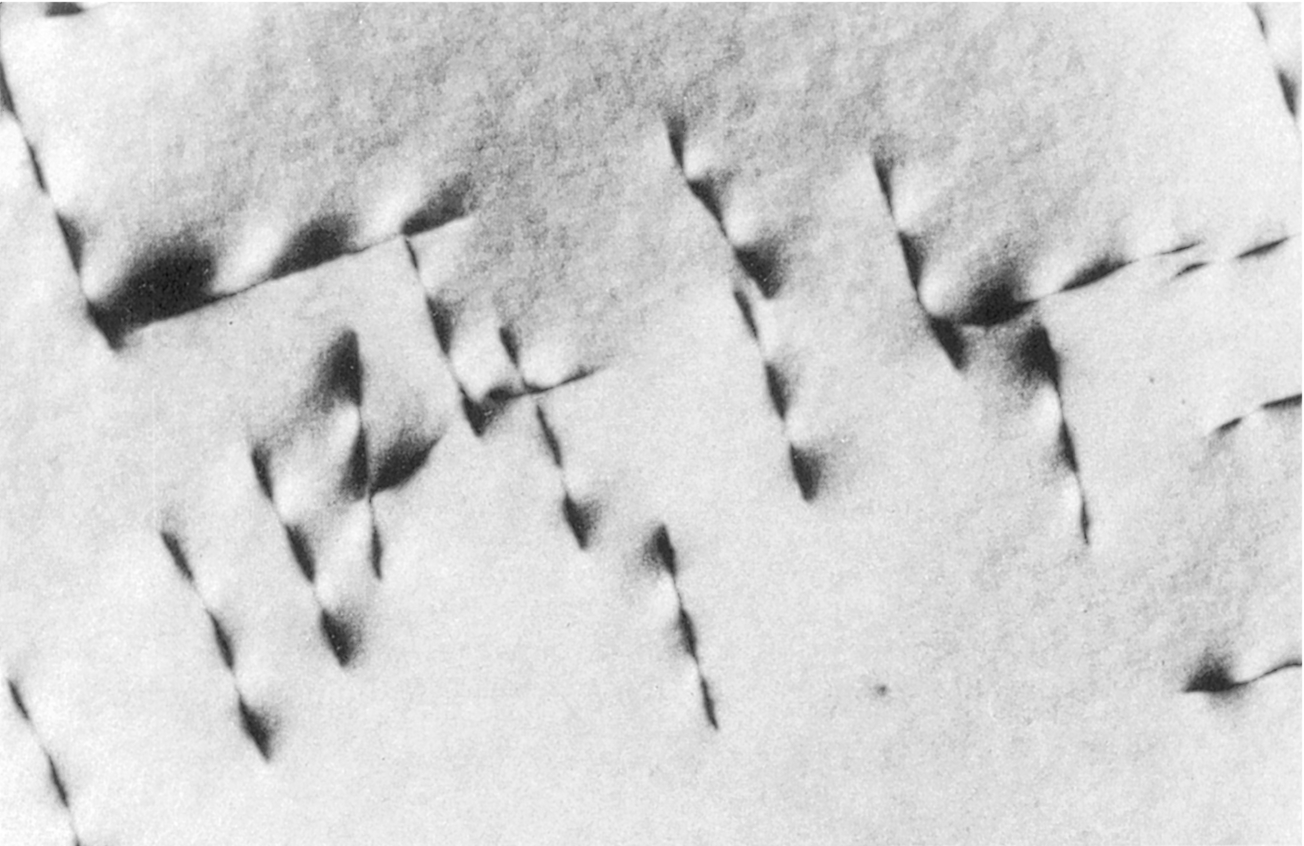
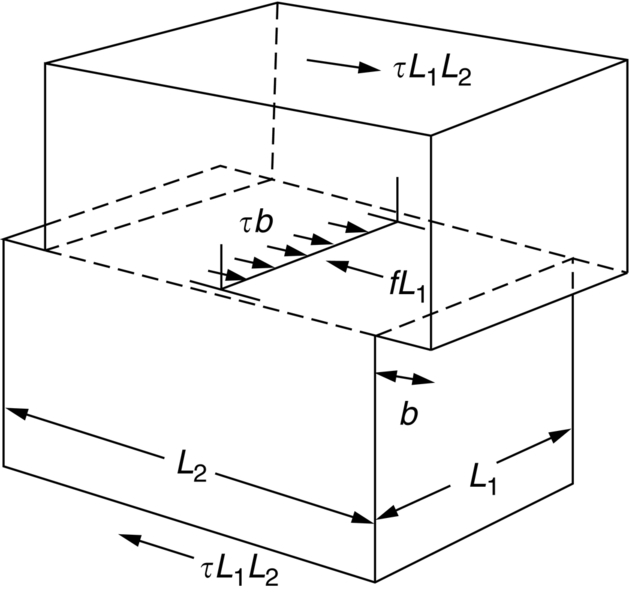
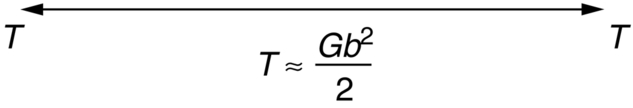
section epub:type=”chapter”> From the understanding of the structure of solids and the stiffness of the bonds between the atoms, is it possible to estimate what the yield strength should be? A simple calculation overestimates it grossly. This is because real crystals contain defects—dislocations—that move easily. When they move, the crystal deforms; the stress needed to move them is the yield strength. Dislocations are the carriers of deformation. The chapter starts with the description of the strength of a perfect crystal. But crystals are not perfect—they have defects in them. Just as the strength of a chain is determined by the strength of the weakest link, so the strength of a crystal—and thus of the material—is usually limited by the defects that are present in it. The dislocation is a particular type of defect that has the effect of allowing materials to deform plastically (yield) at stress levels much less than expected. The chapter focuses on this dislocation in crystals and discusses various properties of dislocations. In the previous chapter we looked at data for the yield strengths of materials. But what would we expect? From our understanding of the structure of solids and the stiffness of the bonds between the atoms, can we estimate what the yield strength should be? A simple calculation (given in the next section) overestimates it grossly. This is because real crystals contain defects—dislocations—which move easily. When they move, the crystal deforms; the stress needed to move them is the yield strength. Dislocations are the carriers of deformation, much as electrons are the carriers of charge. As we showed in Equation (6.1), the slope of the interatomic force–distance curve at the equilibrium separation is proportional to Young’s modulus E. Interatomic forces typically drop off to negligible values at a distance of separation of atom centers of 2r0. The maximum in the force–distance curve is typically reached at 1.25r0 separation, and if the stress applied to the material exceeds this maximum force per bond, fracture is bound to occur. We call the stress at which this bond rupture takes place More refined estimates of Let us now see whether materials really show this strength. The bar chart (Figure 10.2) shows values of σy/E for materials. The heavy broken line at the top is drawn at the level σ/E = 1/15. Glasses, and some ceramics, lie close to this line—they show their ideal strength, and we could not expect them to be stronger than this. Most polymers, too, lie near the line—although they have low yield strengths, these are low because the moduli are low. Metals, on the other hand, have yield strengths far below the levels predicted by our calculation—as much as a factor of 105 less. Even many ceramics yield at stresses that are a factor of 10 below their ideal strength. Why is this? In Chapter 5 we said that many important engineering materials (e.g., metals) were normally made up of crystals, and explained that a perfect crystal was an assembly of atoms packed together in a regularly repeating pattern. But crystals are not perfect—they have defects in them. Just as the strength of a chain is determined by the strength of the weakest link, so the strength of a crystal—and thus of the material—is usually limited by the defects that are present in it. The dislocation is a particular type of defect that has the effect of allowing materials to deform plastically (yield) at stress levels much less than Figure 10.3(a) shows an edge dislocation from a continuum viewpoint (ignoring the atoms). Such a dislocation is made in a block of material by cutting the block up to the line marked ⊥ – ⊥, displacing the material below the cut relative to that above by a distance b (the distance between adjacent planes of atoms), and finally gluing the cut surfaces back together. The result, on an atomic scale, is shown in Figure 10.3(b); the material in the middle of the block now contains a half plane of atoms, with its lower edge lying along the line ⊥ – ⊥ (the dislocation line). This defect is called an edge dislocation because it is formed by the edge of the half plane of atoms, and it is written for short using the symbol ⊥. Dislocation motion produces plastic strain. Figure 10.4 shows how the atoms rearrange as the dislocation moves through the crystal, and how when a dislocation moves through a crystal, the lower part is displaced under the upper by distance b (called the Burgers vector). The same process is drawn without the atoms, and using the symbol ⊥ for the position of the dislocation line, in Figure 10.5. The way in which this dislocation works can be likened to the way in which a large carpet can be moved across a floor simply by moving rucks through the carpet—a much easier process than pulling the whole carpet across at one go (Figure 10.6) Referring back to Figure 10.3 we could, after making the cut, have displaced the lower part of the crystal under the upper part in a direction parallel to the bottom of the cut, instead of normal to it. Figure 10.7 shows the result—it, too, is a dislocation, called a screw dislocation (because it converts the planes of atoms into a helical surface, or screw). Like an edge dislocation, it produces plastic strain when it moves (Figures 10.8 and 10.9). Its geometry is a little more complicated but its properties are otherwise just like those of the edge. Any dislocation, in a real crystal, is either a screw or an edge—or can be thought of as little steps of each. Dislocations can be seen in the electron microscope. Figure 10.10 shows an example. A shear stress (τ) exerts a force on a dislocation, pushing it through the crystal. For yielding to take place, this force must be great enough to overcome the resistance to the motion of the dislocation. This resistance is due to intrinsic friction opposing dislocation motion, plus contributions from alloying or work-hardening; these are discussed in detail in the next chapter. Here we show that the magnitude of the force is τb per unit length of dislocation. We prove this by a virtual work calculation. We equate (a) the work done by the applied stress when the dislocation moves through the crystal, and (b) the work done against the resistance opposing its motion (Figure 10.11). The upper part is displaced relative to the lower by the distance b, so the applied stress does work (τL1L2) × b. In moving through the crystal, the dislocation travels a distance L2, doing work against a resistance f per unit length—fL1 × L2. Equating the two gives This result holds for any dislocation—edge, screw or a mixture of both. The two remaining properties of dislocations that are important in understanding the plastic deformation of materials are the following: In absolute terms, T is small (we should need ≈108 dislocations to hold an apple up) but it is large in relation to the size of a dislocation. In addition, it has an important bearing on the way in which obstacles obstruct the motion of dislocations.
Dislocations and Yielding in Crystals
Publisher Summary
10.1 Introduction
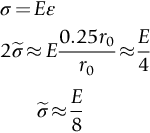
10.2 Strength of a Perfect Crystal
 , the ideal strength—a material cannot be stronger than this. From Figure 10.1
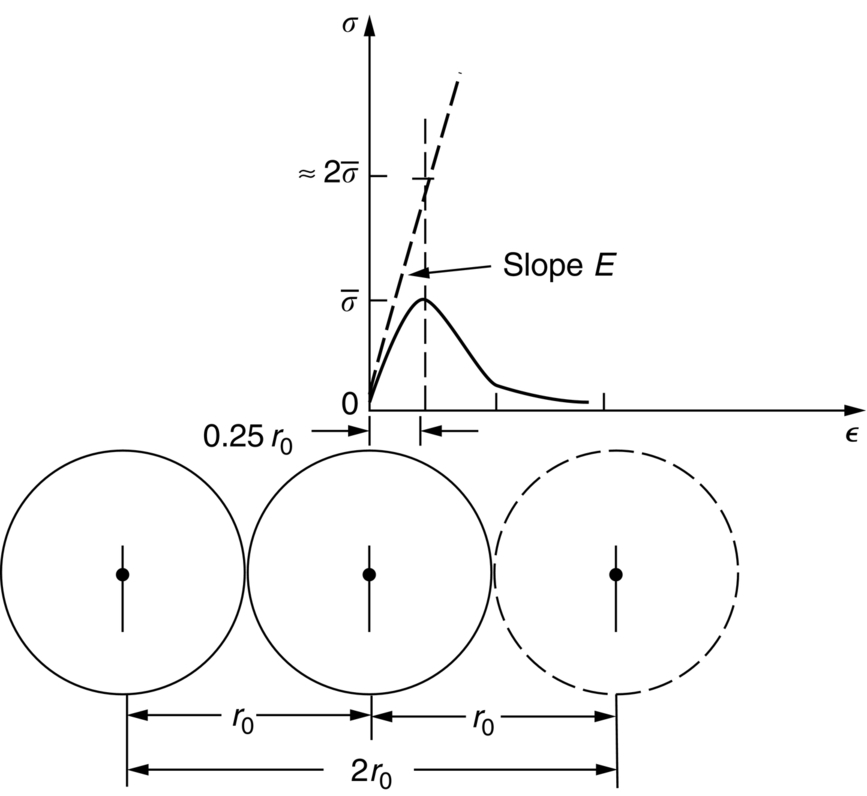
 .
.
 are possible, using real interatomic potentials—they give about E/15 instead of E/8.
10.3 Dislocations in Crystals
 .
.
10.4 Force Acting on a Dislocation
10.5 Other Properties of Dislocations
Examples
Answers
(From Table 3.1, E for copper = 124 GN m–2.) Very small compared to the latent heat of melting. Be careful with the units!