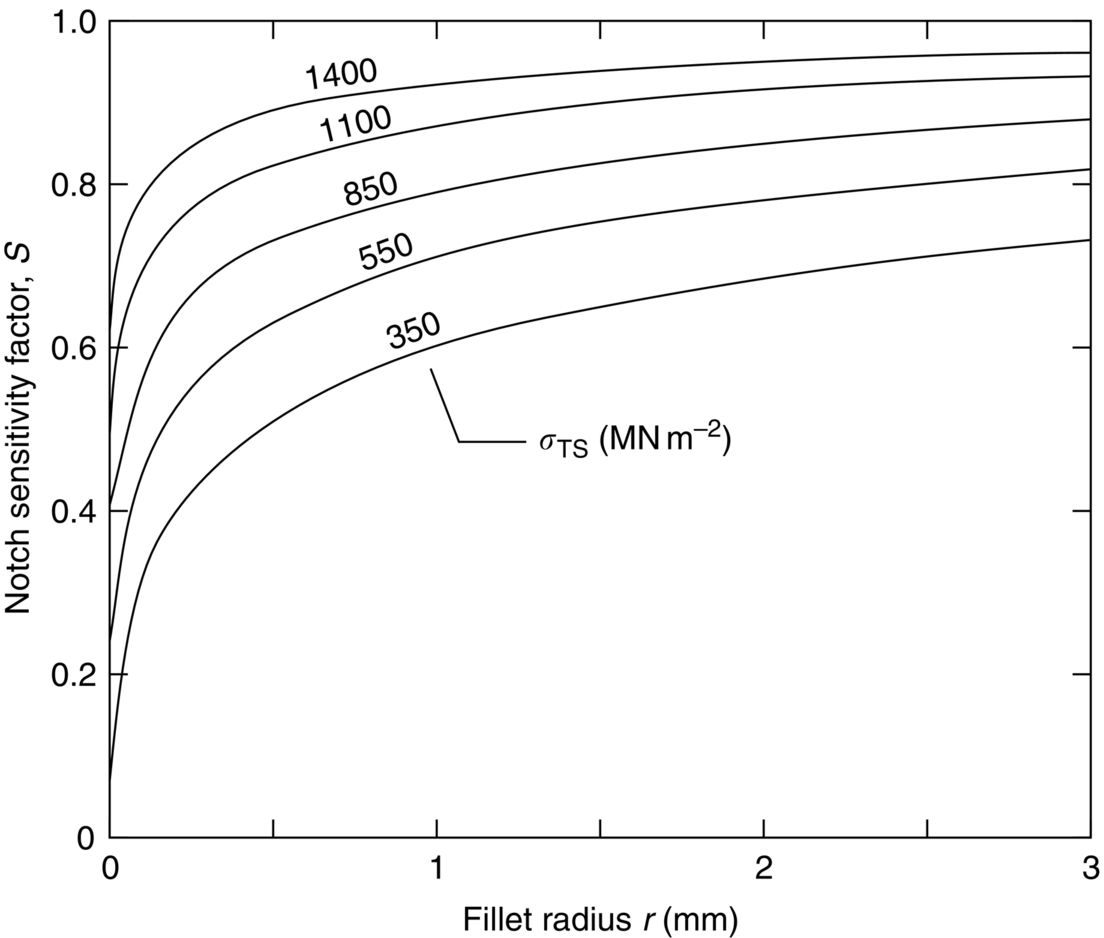
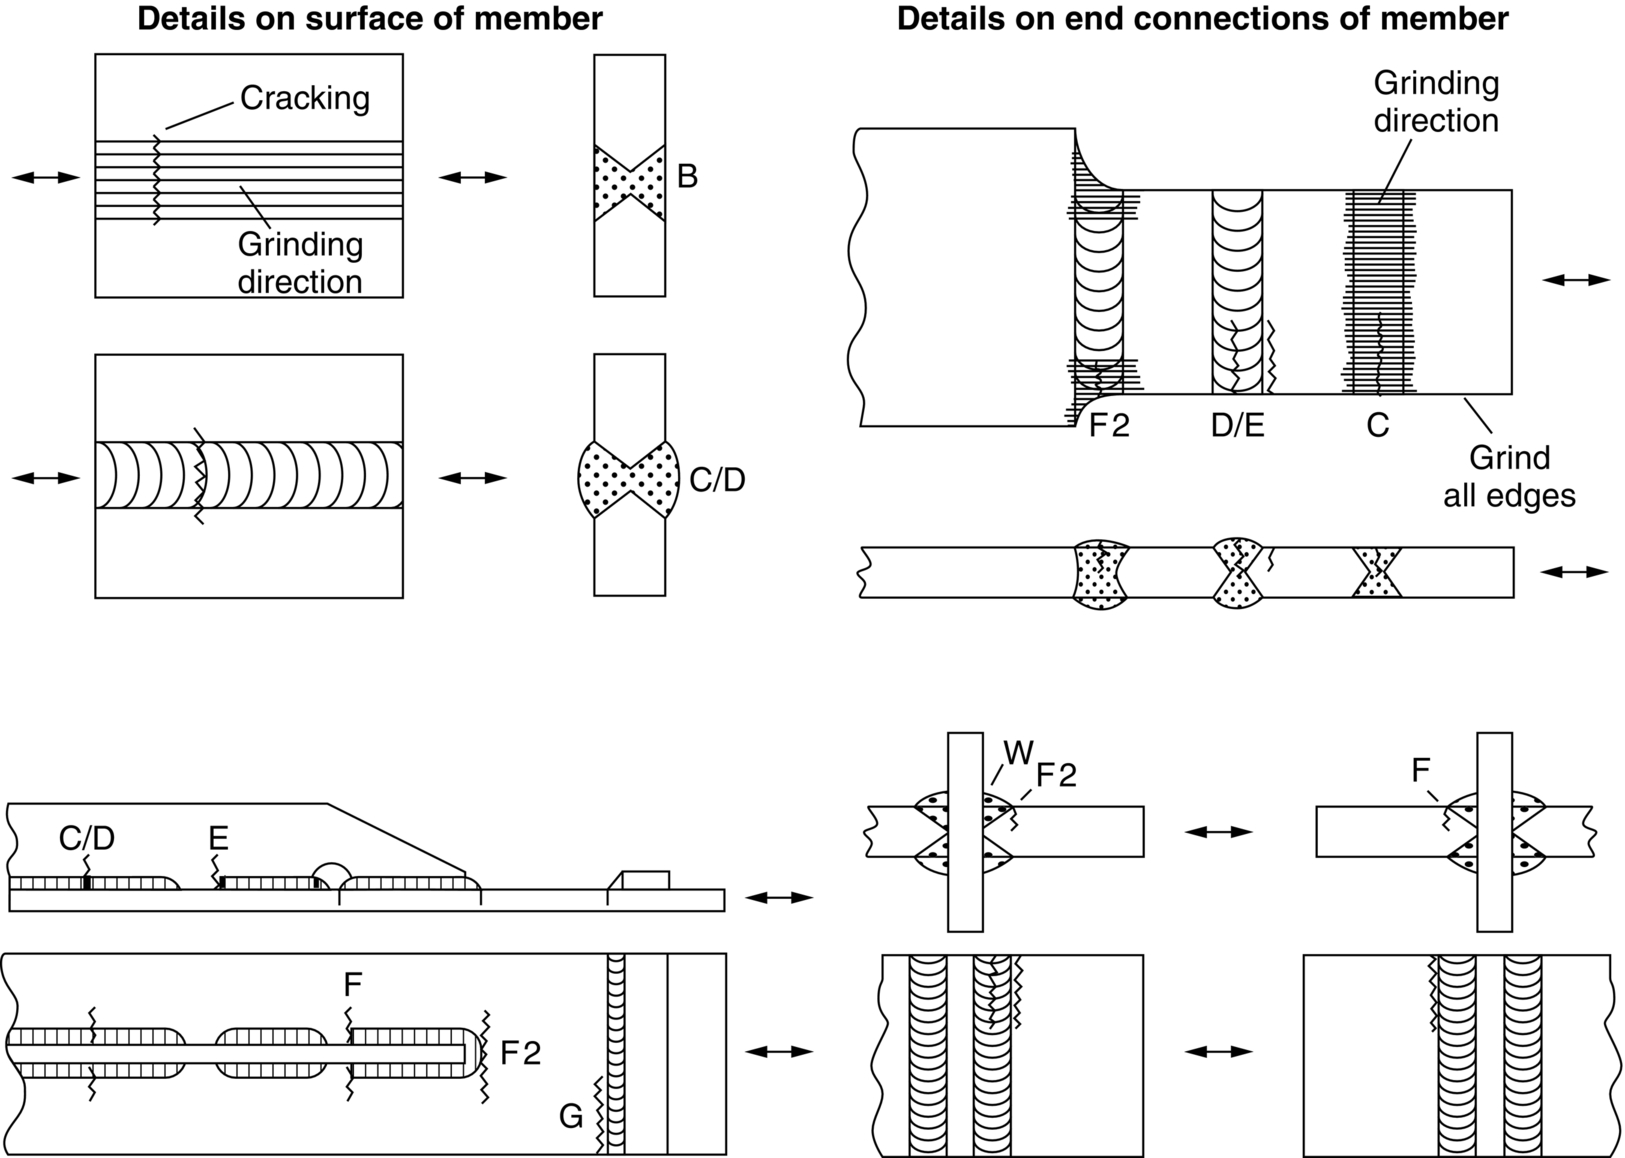
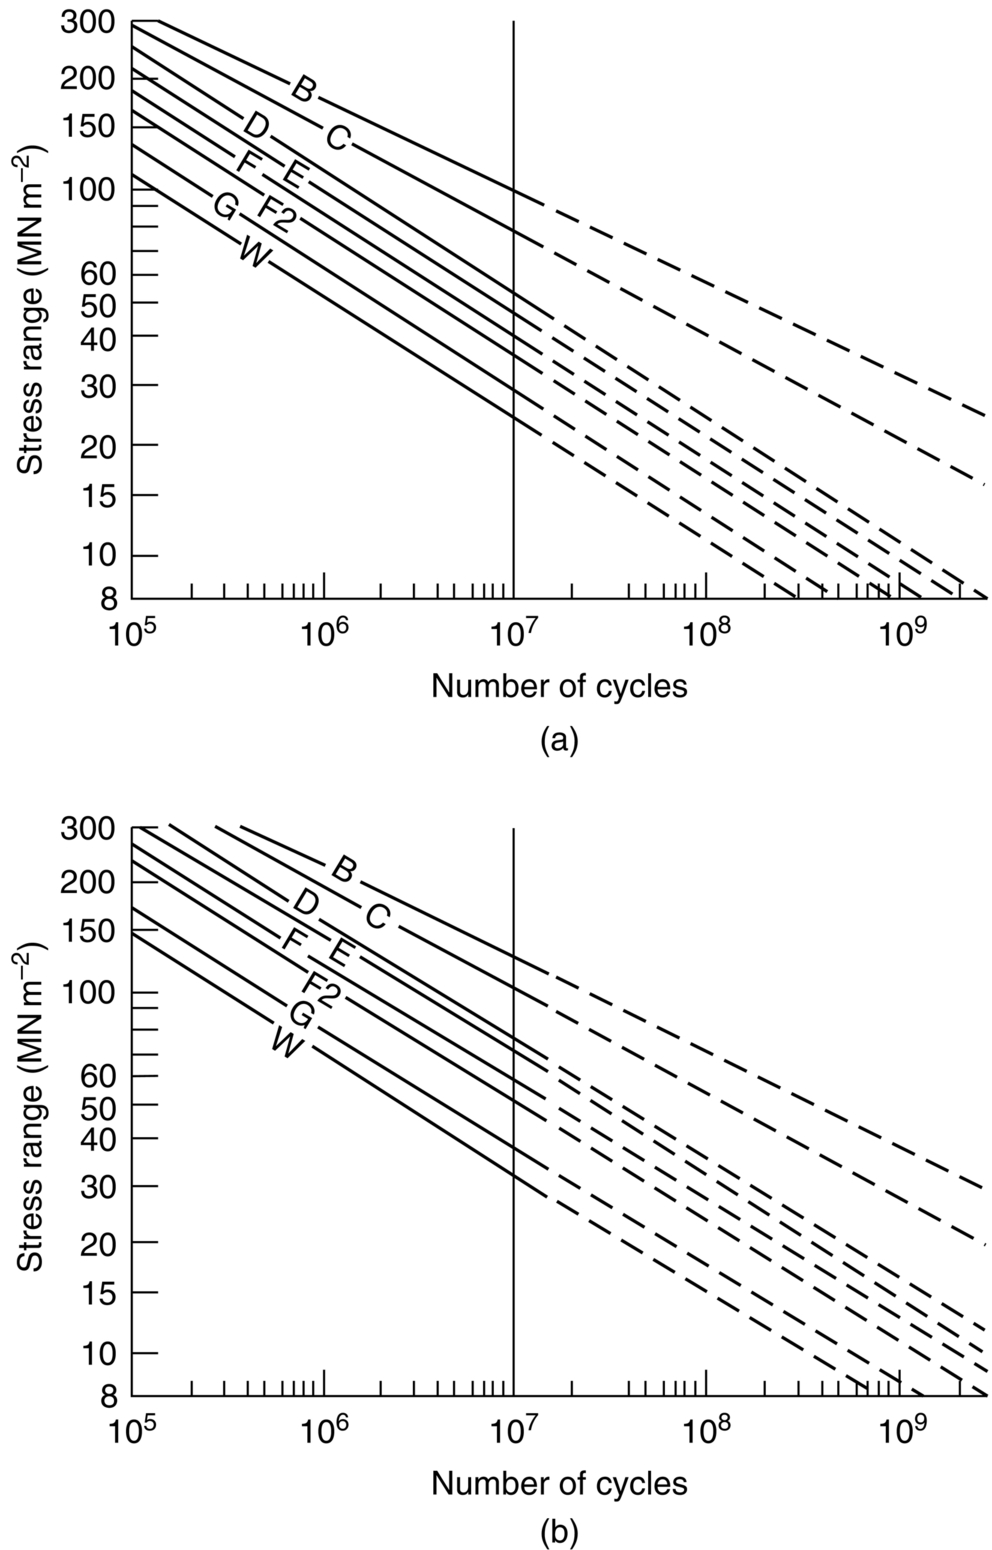
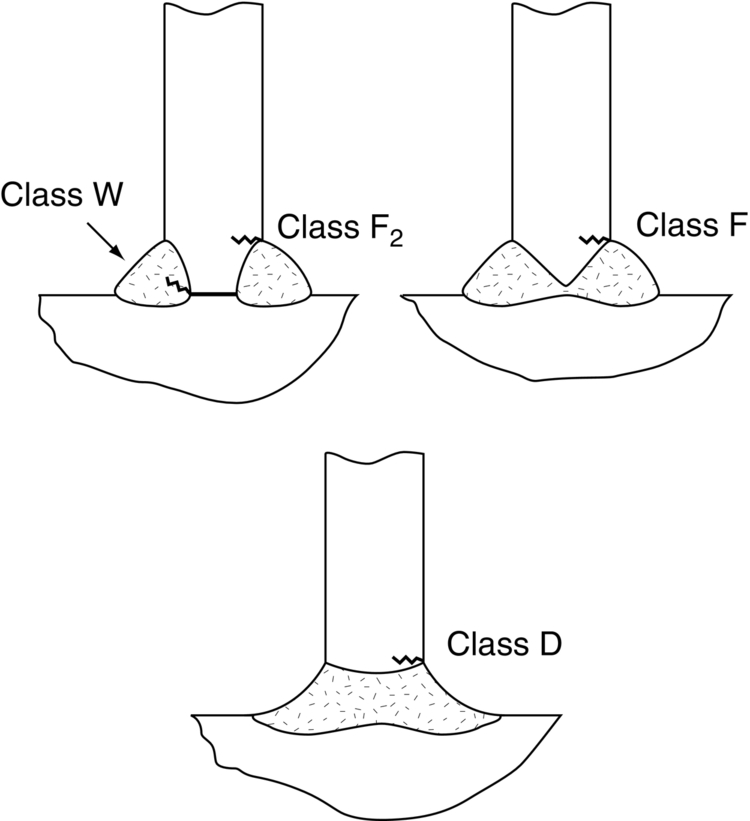
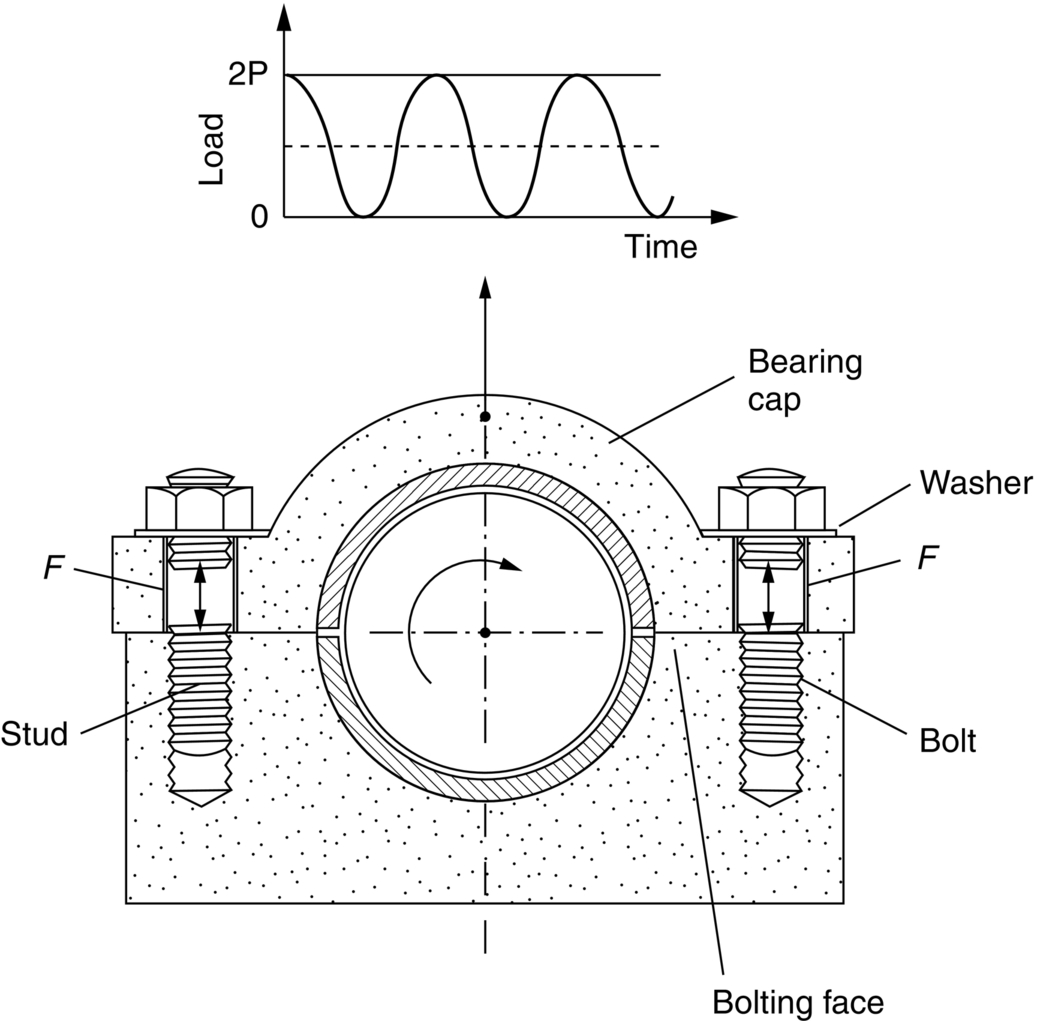
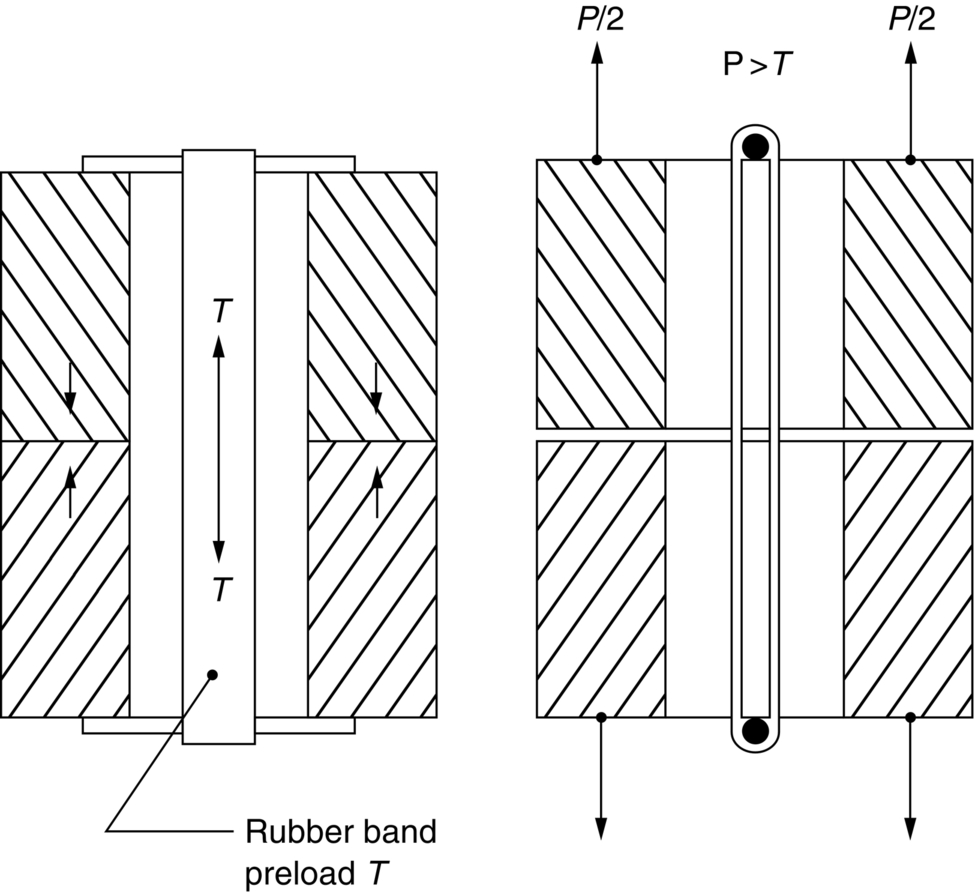
section epub:type=”chapter”> This chapter presents a discussion of fatigue design. The chapter presents data for the fatigue strengths of metals and alloys (useful for designing mechanical components) and for welded joints (important in large structures such as bridges and oil rigs). The chapter discusses the problems of stress concentrations produced by abrupt changes in cross-section (e.g., shoulders or holes). The chapter shows how fatigue strength can be improved by better surface finish, better component geometry, and compressive residual surface stress. The chapter explores how the preloading of bolts is essential in bolted connections such as car engine big-end bearings. The chapter provides high-cycle fatigue data for uncracked specimens tested about zero mean stress. The chapter also discusses stress concentrations, notch sensitivity factor, and fatigue data for welded joints. The chapter concludes with a discussion of various fatigue improvement techniques. In this chapter we look at a number of aspects of fatigue that are relevant to designing structures or components against fatigue failure in service. We give data for the fatigue strengths of metals and alloys (useful for designing mechanical components) and for welded joints (important in large structures such as bridges and oil rigs). We look at the problems of stress concentrations produced by abrupt changes in cross-section (e.g., shoulders or holes). We see how fatigue strength can be improved by better surface finish, better component geometry, and compressive residual surface stress. In addition, we look at how the preloading of bolts is essential in bolted connections such as car engine big-end bearings. Table 19.1 gives high-cycle fatigue data for uncracked specimens tested about zero mean stress. The data are for specimens with an excellent surface finish tested in clean dry air. Fatigue strengths can be considerably less than these if the surface finish is poor, or if the environment is corrosive. Table 19.1 Obviously, if we have a real component with an excellent surface finish in clean dry air, then if it is to survive 108 cycles of constant-amplitude fatigue loading about zero mean stress, the stress amplitude Δσ/2 in service must be less than that given in Table 19.1 by a suitable safety factor. If the mean stress is not zero, then Equation (18.4) can be used to calculate the fatigue strength under conditions of non-zero mean stress. In the absence of specific data, it is useful to know that Δσ/2 = CσTS. The value of the constant C is typically 0.3 to 0.5 depending on the material. Any abrupt change in the cross section of a loaded component causes the local stress to increase above that of the background stress. The ratio of the maximum local stress to the background stress is called the stress concentration factor, or SCF for short. Figure 19.1 gives details of the SCF for two common changes in section—a hole in an axially loaded plate and a shouldered shaft in bending. The hole gives an SCF of 3. The SCF of the shaft is critically dependent on the ratio of the fillet radius r to the minor shaft diameter d—to minimize the SCF, r/d should be maximized. Obviously, fatigue failure will occur preferentially at sites of local stress concentration. If a component has an SCF then it is the maximum local stress which must be kept below the material fatigue strength, and not the background stress. Taking the shouldered shaft as an example, we can see that as the r/d ratio decreases toward zero (a sharp corner) the SCF should increase toward infinity. This implies that any component with a sharp corner, or notch, will always fail by fatigue no matter how low the background stress! Clearly, this is not correct, because there are many components with sharp corners which are used successfully in fatigue loading (although this is very bad practice). In fatigue terminology, we define an effective stress concentration factor, SCFeff such that SCFeff < SCF. The two are related by the equation where S, the notch sensitivity factor, lies between 0 and 1. If the material is fully notch sensitive, S = 1 and SCFeff = SCF. If the material is not notch sensitive, S = 0 and SCFeff = 1. Figure 19.2 shows that S increases with increasing σTS and fillet radius r. We would expect S to increase with σTS. As we saw in Chapter 15 for sharp cracks, material at the fillet radius can yield in response to the local stress, and this will limit the maximum local stress to the yield stress. In general, increasing σTS increases σy. In turn, this increases the maximum local stress which can be sustained before yielding limits the stress, and helps keep SCFeff ≈ SCF. The decrease in S with decreasing r has a different origin. As Figure 19.2 shows, as r tends toward zero, S also tends toward zero for all values of σTS. This is because a sharp notch produces a small process zone (the zone in which the fatigue crack initiates) and this makes it harder for a fatigue crack to grow. We saw in Chapter 17 that the tensile strength of a brittle component increases as the volume decreases. This size effect also applies to the formation of fatigue cracks—the smaller the process zone, the larger the fatigue strength of the component. The notch sensitivity curves in Figure 19.2 have an interesting implication for designing components with small fillet radii. One would think that increasing the tensile strength (and hence the fatigue strength) of the material would increase the fatigue strength of the component. However, this is partly offset by the increase in notch sensitivity, which increases the value of the effective SCF by Equation (19.1). Fortunately, as we shall see later, there are other ways of increasing the fatigue strength of notched components. Welding is the preferred method for joining structural steels and aluminum alloys in many applications. The world is awash with welds subjected to fatigue loading—bridges, oil rigs, ships, boats, chemical plants, and so on. Because welded joints are so important (and because they have some special features) there is a large amount of data in constructional standards for weld fatigue strength. Figure 19.3 shows how the various types of welded joints can be categorized into standard weld classes. Figure 19.4 gives the fatigue strengths of the classes for structural steel. The 97.7% survival lines are used for design purposes, and the 50% lines for analyzing welds which actually failed. It is important to note that the vertical axis of the fatigue lines in Figure 19.4 is the full stress range Δσ, and not the Δσ/2 conventionally used for high-cycle fatigue data (see Table 19.1). From that table, we can see that Δσ for steel (108 cycles) is at least 2 × 170 = 340 MN m–2. The Δσ for a class G weld (108 cycles) is only 20 MN m–2. This huge difference is due mainly to three special features of the weld—the large SCF, the rough surface finish, and the presence of small crack-like defects produced by the welding process. It is important to note that the fatigue strength of welds does not depend on the value of the mean stress in the fatigue cycle. Equation 18.4 should not be used for welds. This makes life much easier for the designer—the data in Figure 19.4 work for any mean stress, and the input required is simply the stress range. This major difference from conventional fatigue data is again due to a special feature of welded joints. Welds contain tensile residual stresses that are usually equal to the yield stress (these residual stresses are produced when the weld cools and contracts after the weld bead has been deposited). Whatever the applied stress cycle, the actual stress cycle in the weld itself always has a maximum stress of σy and a minimum stress of σy − Δσ. We have already seen that the fatigue strength of a component can be increased by minimizing stress concentration factors, and having a good surface finish (a rough surface is, after all, just a collection of small stress concentrations). However, it is not always possible to remove SCFs completely. A good example is a screw thread, or the junction between the shank and the head of a bolt, which cannot be removed without destroying the functionality of the component. The answer here is to introduce a residual compressive stress into the region of potential crack initiation. This can be done using thread rolling (for screw threads), roller peening (for fillet radii on bolts or shafts), hole expansion (for pre-drilled holes), and shot peening (for relatively flat surfaces). The compressive stress makes it more difficult for fatigue cracks to grow away from the initiation sites in the surface. Figure 19.5 shows how the fatigue strengths of welds can be improved. The first step is to improve the class of weld, if this is possible. By having a full penetration weld, the very poor class W weld is eliminated, and the class of the connection is raised to class F. Further improvements are possible by grinding the weld bead to improve surface finish, reduce SCFs, and remove welding defects. Finally, shot peening can be used to put the surface into residual compression. In some applications, the fatigue strength of the component cannot easily be made large enough to avoid failure under the applied loading. But there may be design-based solutions, which involve reducing or even eliminating the stress range that the loading cycle produces in the component. A good example is the design of bolted connections in the bearing housings of automotive crankshafts and con-rod big ends. Looking at Figure 19.6, it is easy to see that if the bolts are left slightly slack on assembly, the whole of the applied loading is taken by the two bolts (there is nothing else to take a tensile load). The load in each bolt therefore cycles from 0 to P to 0 with each cycle of applied loading. The situation is quite different if the bolts are torqued-up to produce a large tension (or preload) in the bolts at assembly. The situation can be modeled very clearly as shown in Figure 19.7. Here, the bolt is represented by a rubber band, assembled with a tension T. There is an equal and opposite compressive force at the interface between the two halves of the housing. As the connection is loaded, nothing obvious happens, until the applied load P reaches T. Then, the two halves of the housing begin to separate. Provided P < T, the bolt sees no variation in stress at all. The variations in the applied load are provided by variations in the compressive force at the interface between the two halves of the housing. Of course, in a real connection, the bolt does not behave in such a springy way as a rubber band. But provided the bolts are long and have a small diameter, it is possible to make them springy enough that they are shielded from most of the variations in the applied loading cycle. In critical cases, the bolts may be “waisted”—except where the bolt must be threaded to take the nut, it is machined to a smooth diameter which is less than the core diameter of the thread. This increases the “give” of the bolt, and also removes unnecessary threads, which are a potential source of fatigue cracking. Incidentally, this is one reason why bolts for fatigue critical applications are made from high tensile steel—they must not break in tension under the high preload even if they have a small diameter. The photographs that follow show traffic lights in Manhattan (Upper West Side, Broadway at W 80th and W 77th). These are everyday sights in New York City and are ignored by all the pedestrians. But we are different. We are engineers, and we take delight in seeing interesting things in even the most ordinary surroundings—things that non-engineers are completely unaware of. Look at the lamp unit hanging from its mast. How is it attached to the mast? There is a double clevis arrangement, with bolts to allow the clevises to rotate. This can be seen in the zoom view, but is quite obvious from street level. Why bother to do this? Surely it would be cheaper and quicker just to weld the top of the lamp unit straight on to the end of the mast. But what is the loading? Self weight, yes—but variable loadings? Of course, wind loadings—remember just how fast the wind can whistle down the avenues between the high-rise buildings. If it is windy today, maybe you can see the lamp units swinging below their masts. If you let them swing, you will design out the fatigue stresses! Then, there is no need to determine the fatigue loadings (expensive), or choose a class of weld with a large enough fatigue strength (many engineers don’t know how to do this), or make sure that the weld is well made every time (not easy with low-tech fabrications). So, by designing out the fatigue problem, you save a lot of money—and you avoid a significant chance that, sooner or later, a lamp unit will fall off and kill someone. And you also make it easy to remove the lamp unit for servicing. Is that all? No—what about wear on the bolts? You need to check this periodically on typical units, and if necessary put in place a bolt renewal protocol. In fact, all structures should be inspected from time to time in case faults have developed that the designer did not envisage.
Fatigue Design
Publisher Summary
19.1 Introduction
19.2 Fatigue Data for Uncracked Components
Metal or Alloy
Stress Amplitude Δσ/2 for Failure after 108 Cycles (Zero Mean Stress) (MN m-2)
Aluminum
35–60
Aluminum alloys
50–170
Copper
60–120
Copper alloys
100–300
Magnesium alloys
50–100
Nickel
230–340
Nickel alloys
230–620
Steels
170–500
Titanium
180–250
Titanium alloys
250–600
19.3 Stress Concentrations
19.4 Notch Sensitivity Factor
19.5 Fatigue Data for Welded Joints
19.6 Fatigue Improvement Techniques
19.7 Designing Out Fatigue Cycles
Worked Example


Examples
Diameter of double-acting cylinder
90 mm
Diameter of driving wheel
235 mm
Steam pressure inside cylinder at point of admission
7-bar gauge
Estimated annual distance traveled
6000 km
Design life
20 years minimum
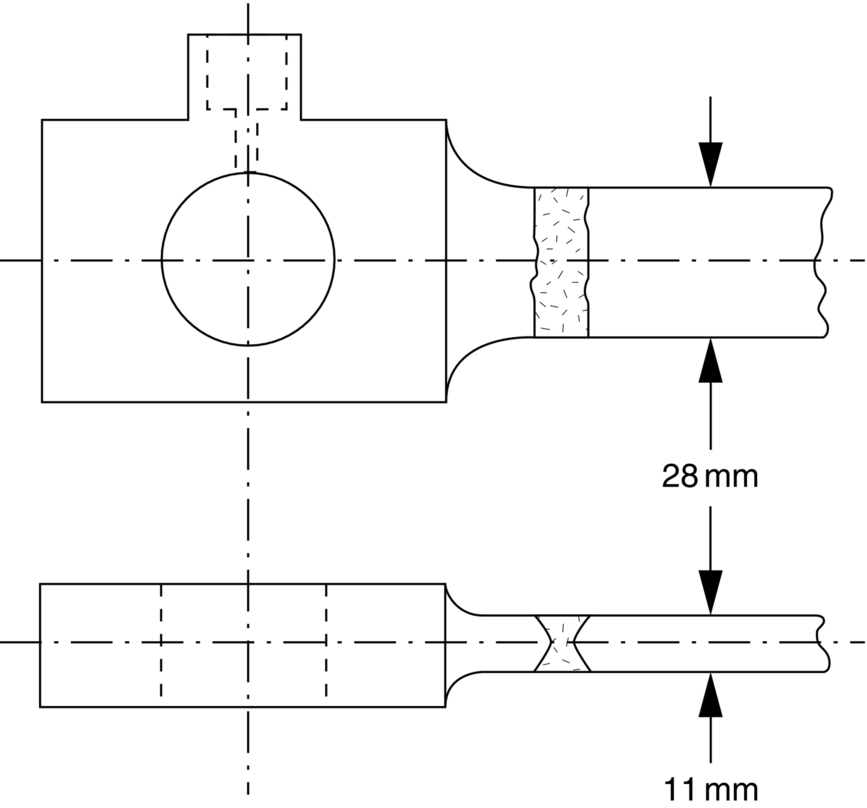
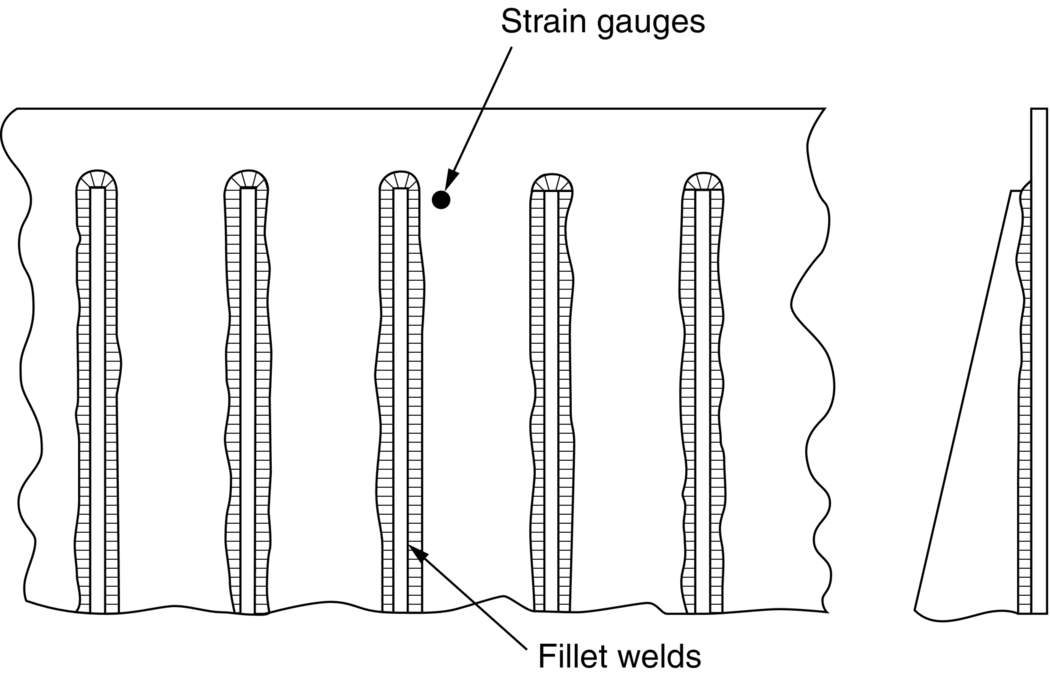
The side of one box consists of a relatively thin plate which is stiffened with triangular gussets, as shown in the preceding diagram. Strain gauges attached to the plate during operation show that the maximum principal stress range in the plate near end of the gusset is 8 MN m–2.
Using this equation, calculate (a) the stress amplitude and (b) the mean stress of the stress cycle. Given that the true fracture stress of the alloy is 250 MN m–2, estimate (c) the stress amplitude that would produce the same fatigue life under conditions of zero mean stress. Use Equation (18.4).
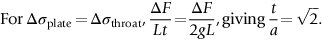
For a “T” joint, as shown in the diagram, calculate the ratio of plate thickness to leg length, t/a, which produces the same stress range in both plate and weld throat.
Estimate the t/a ratio that allows both class W and class F2 cracking to occur at the same time.
Effective throat dimension = g
Length of weld runs = L
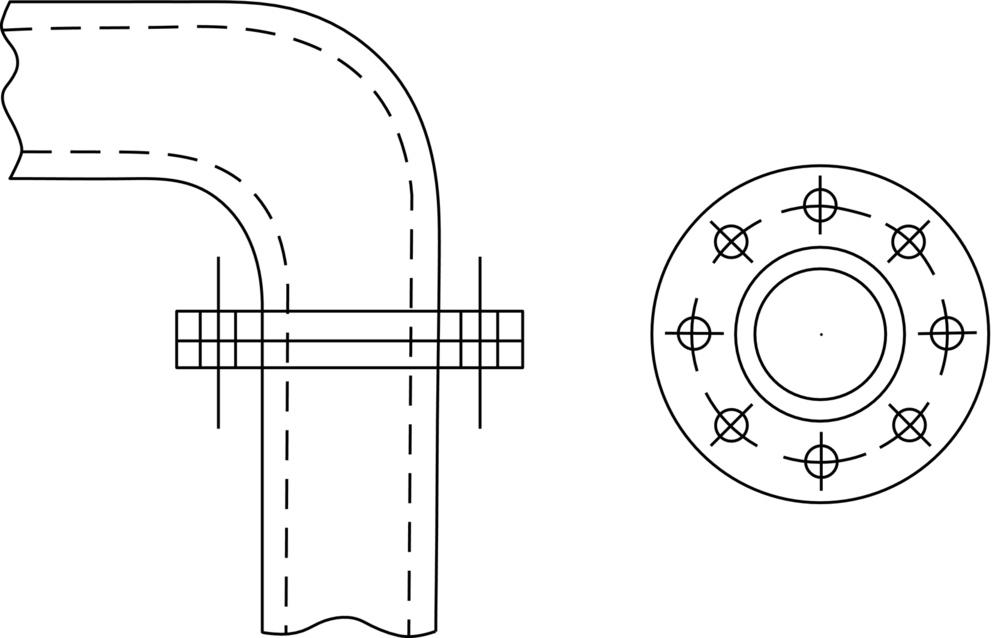
The fatigue crack had started from a 3 mm air hole, which had been drilled through the tube wall at original manufacture. Why did the fatigue crack initiate at the hole? Where around the circumference of the hole would the fatigue crack have initiated? Estimate the margin of safety (in terms of loading) against fatigue cracking if the hole had not been there at all.

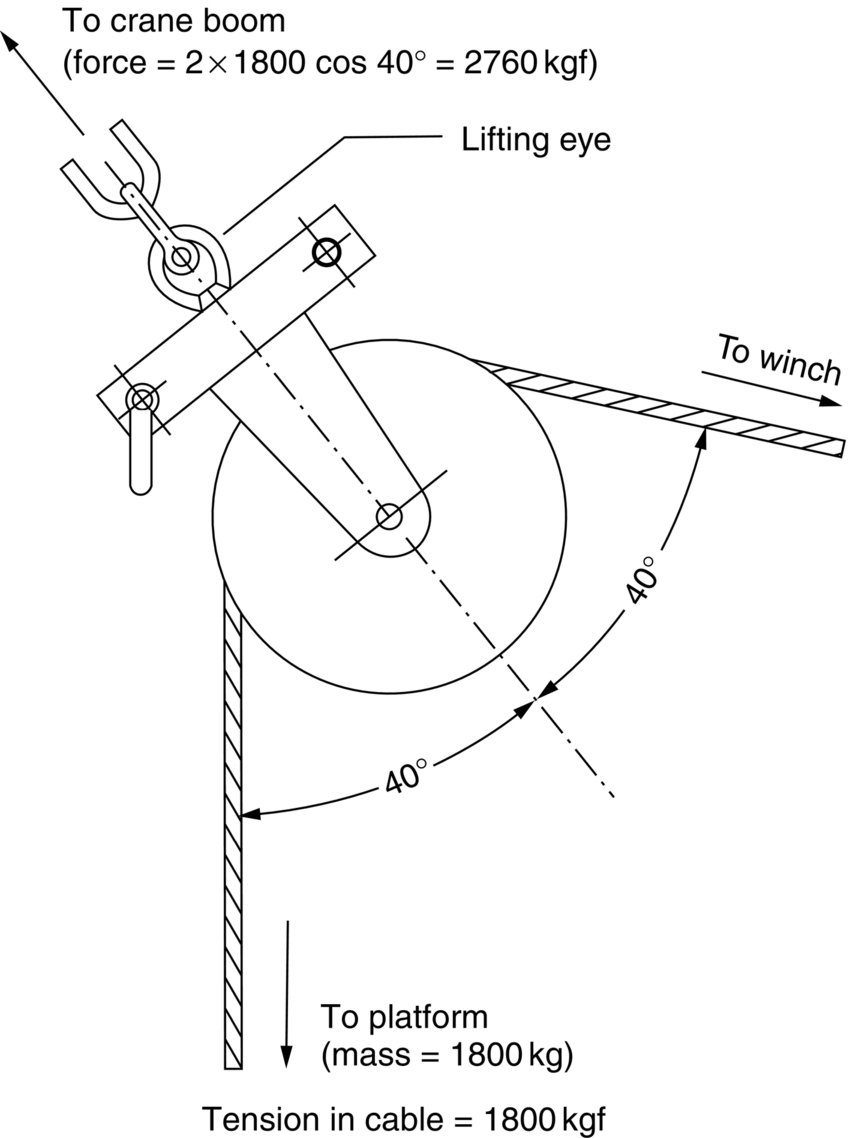
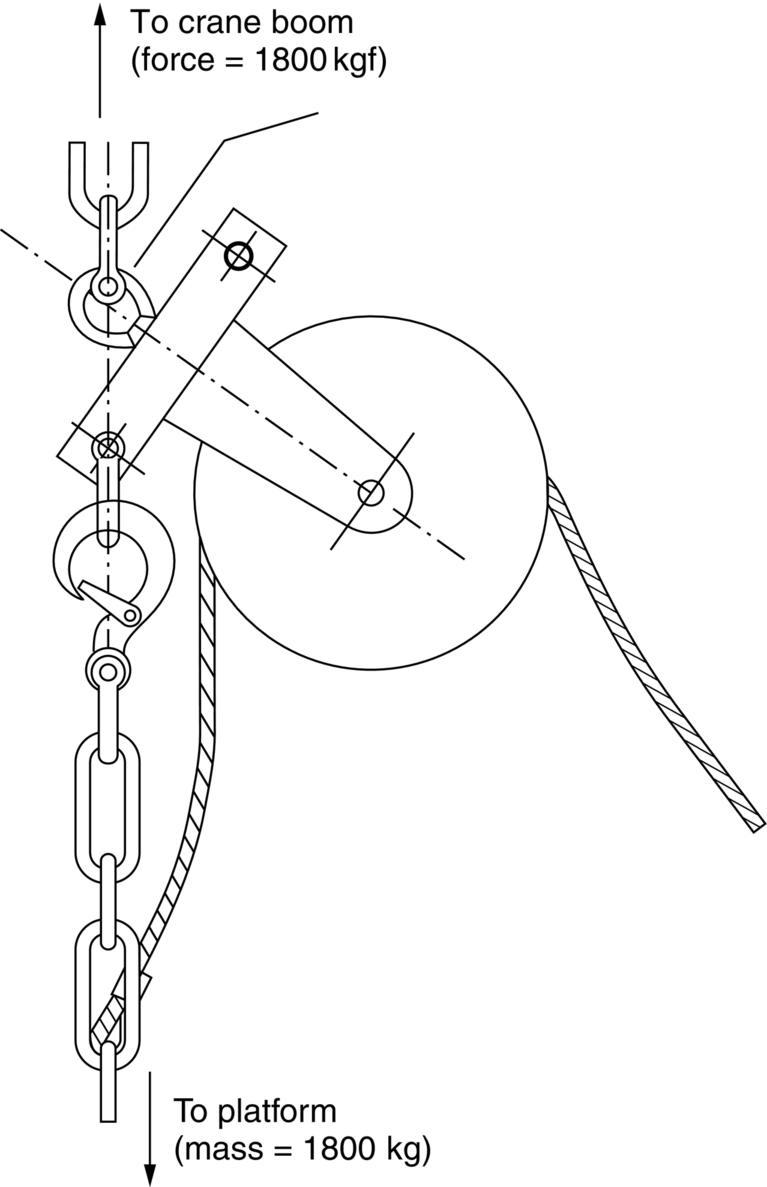
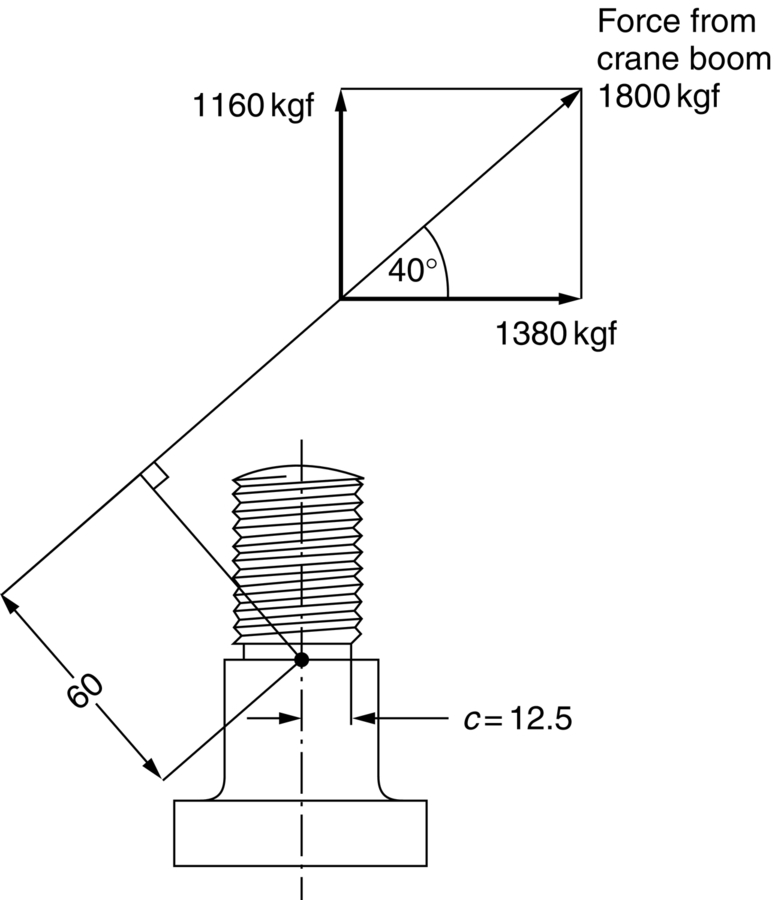
The steel of the bolt had a yield strength of 540 MN m–2. How would you modify the design to ensure that the connection between the lifting eye and the pulley block is less likely to fail by fatigue?
 .
.
 .
.
Answers
(b) At the top of the 4-mm diameter section—the position of maximum tensile bending stress.
(c) Put a radius on the transition from 4.75 to 4 mm, with a good surface finish, countersink the hole in the roller to match, and hope for the best!
(d) Titanium alloy (see Table 19.1). This has a maximum fatigue strength of 600 MN m–2 compared to a maximum fatigue strength for aluminum alloy of 170 MN m–2, yet is only about 50% heavier for the same volume (see Table 5.1).
Refer to the weld fatigue curves of Figure 19.4 (50% survival). At 107 cycles, Δσ for class W = 32 MN m–2, and Δσ for class F2 = 49 MN m–2. For the same fatigue lives in the “T” joint, we therefore need
Note that the same result would be obtained for any given number of cycles, because the fatigue curves are plotted on log-log scales, and the lines for the two weld classes are parallel to one another, i.e., the ratios of the fatigue strengths are independent of the number of cycles.
In spite of these measures, the load shielding of the bolts is limited by their short length, which is defined by the combined thickness of the flanges. The design modification involves making the bolts much longer, so they have more “give,” and see less of the applied loading cycle. This can be done by inserting a length of thick-walled tube between the underside of the nut and the outer face of the flange.
Do away with the lifting eye altogether, and extend the top of the pulley block to provide a horizontal hole to take the pin of a shackle. Because the rotational degree of freedom provided by the lifting eye assembly has now been lost, it will be necessary to insert an inline swivel-link (a standard item) between the shackle and the crane boom.
 give the required result.
 give the required result.