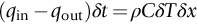
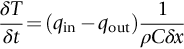
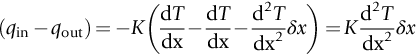
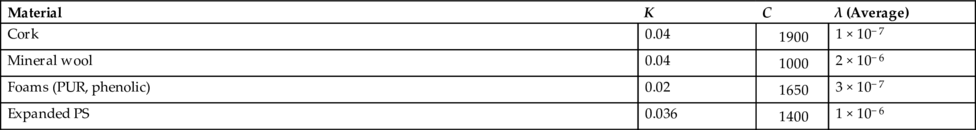
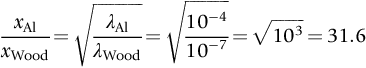
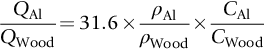
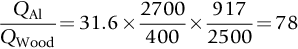
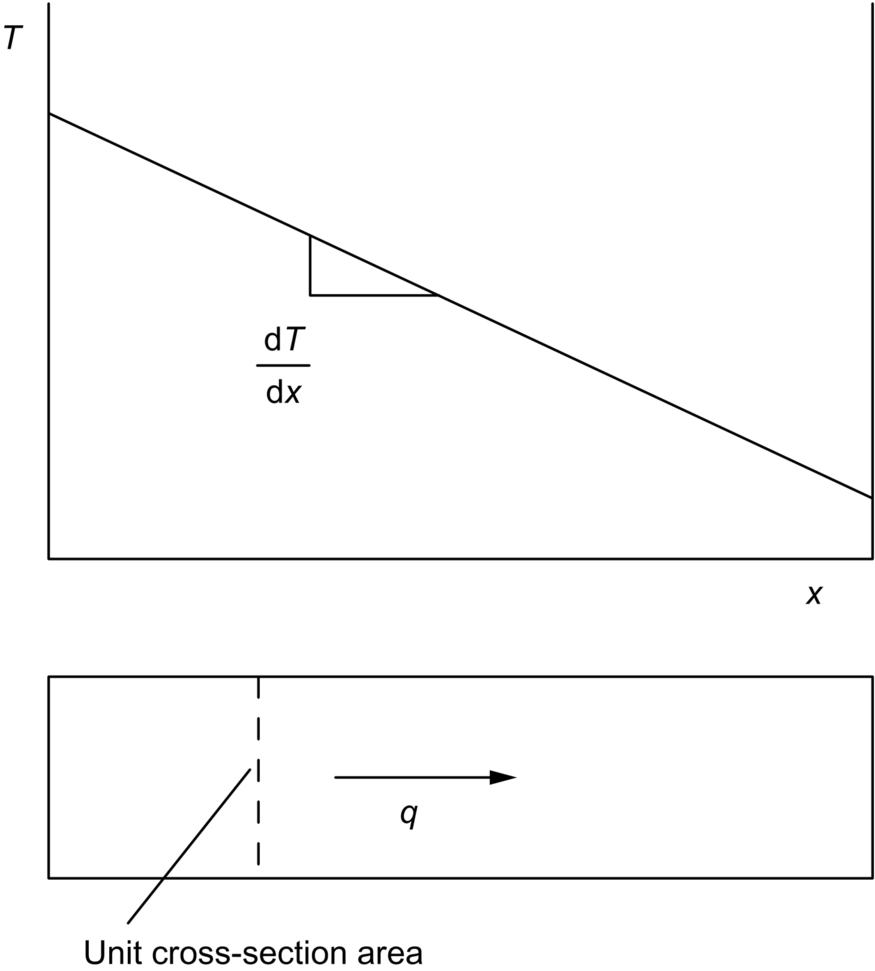
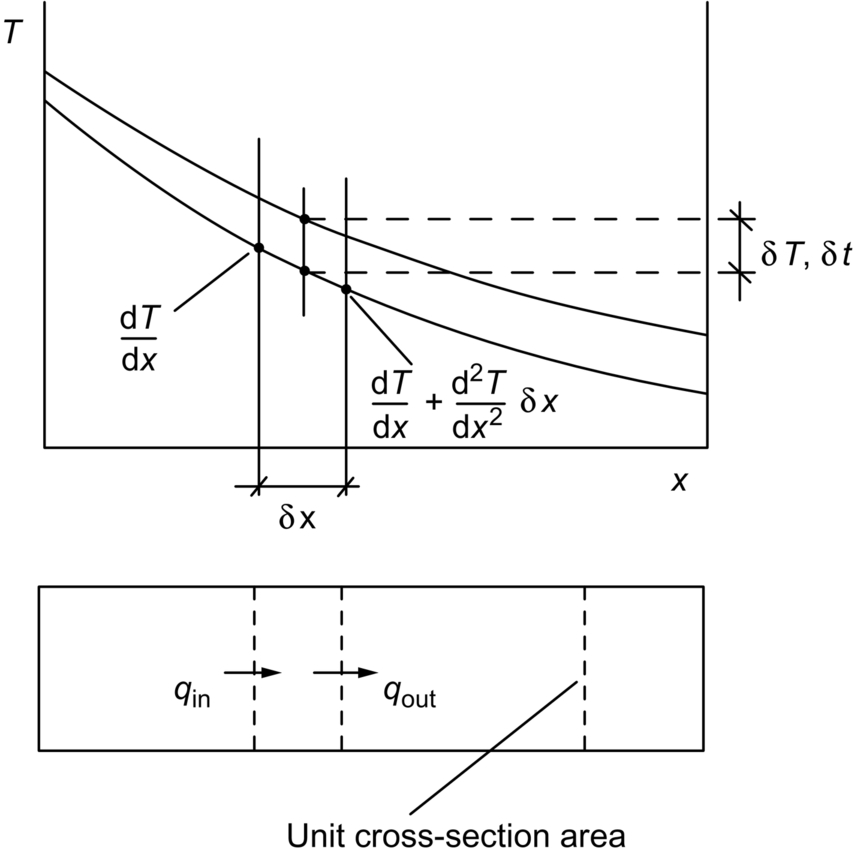
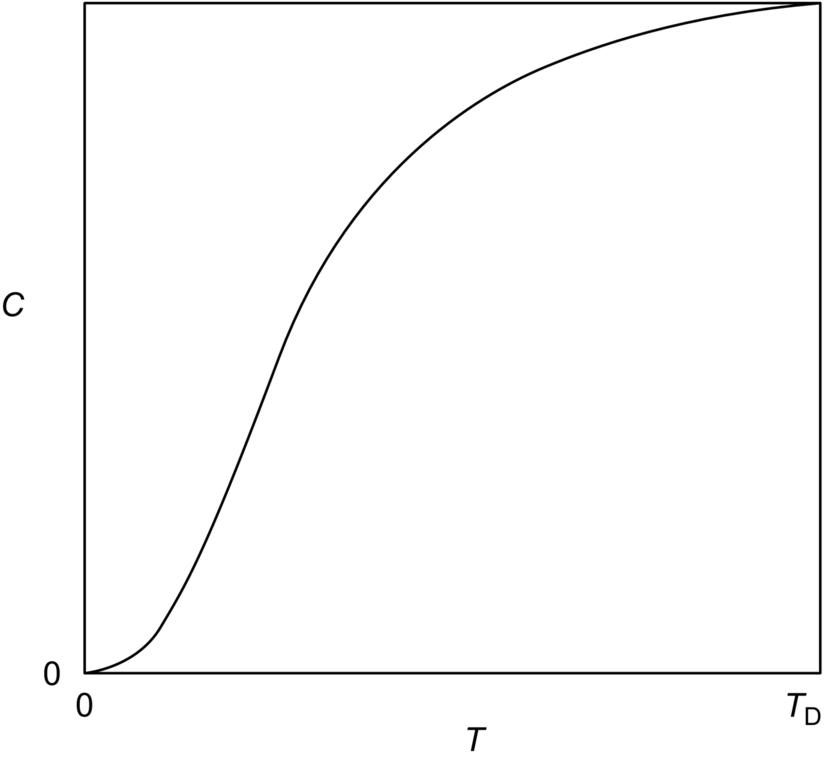
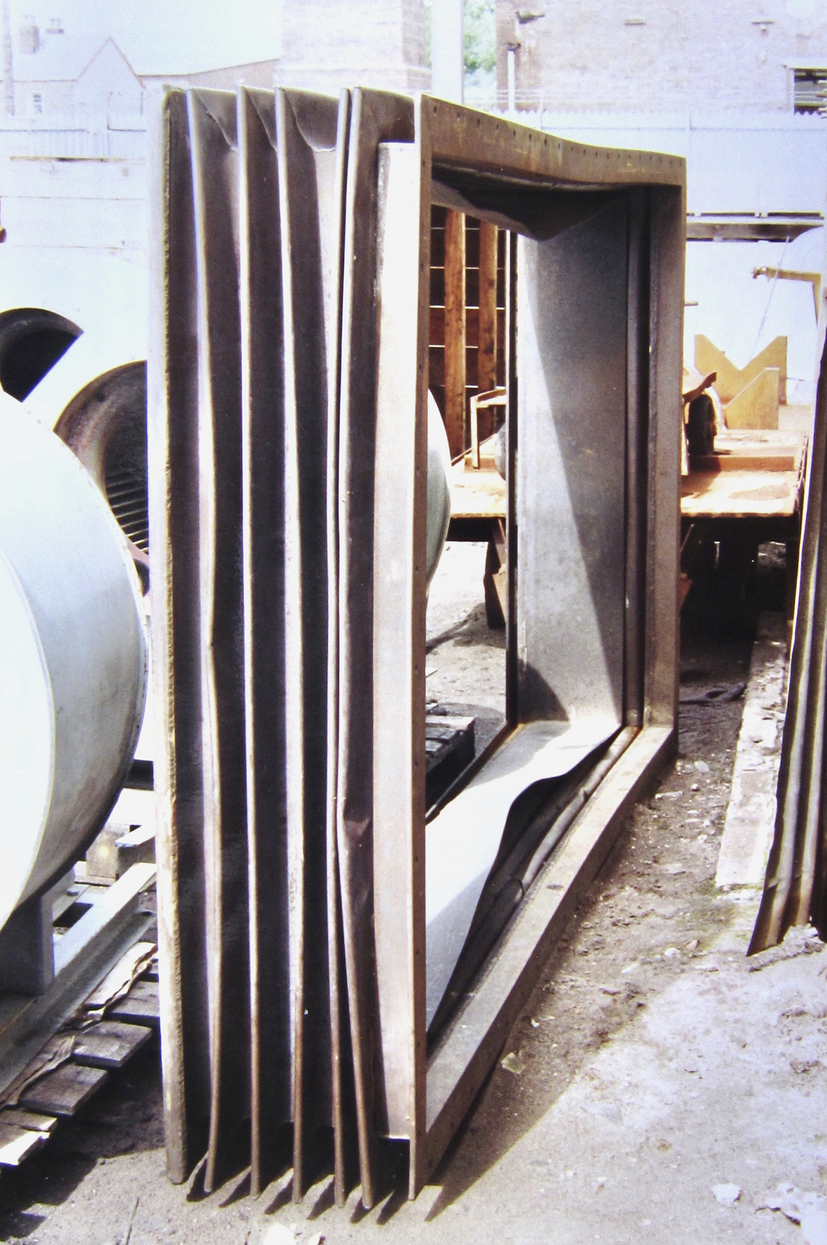
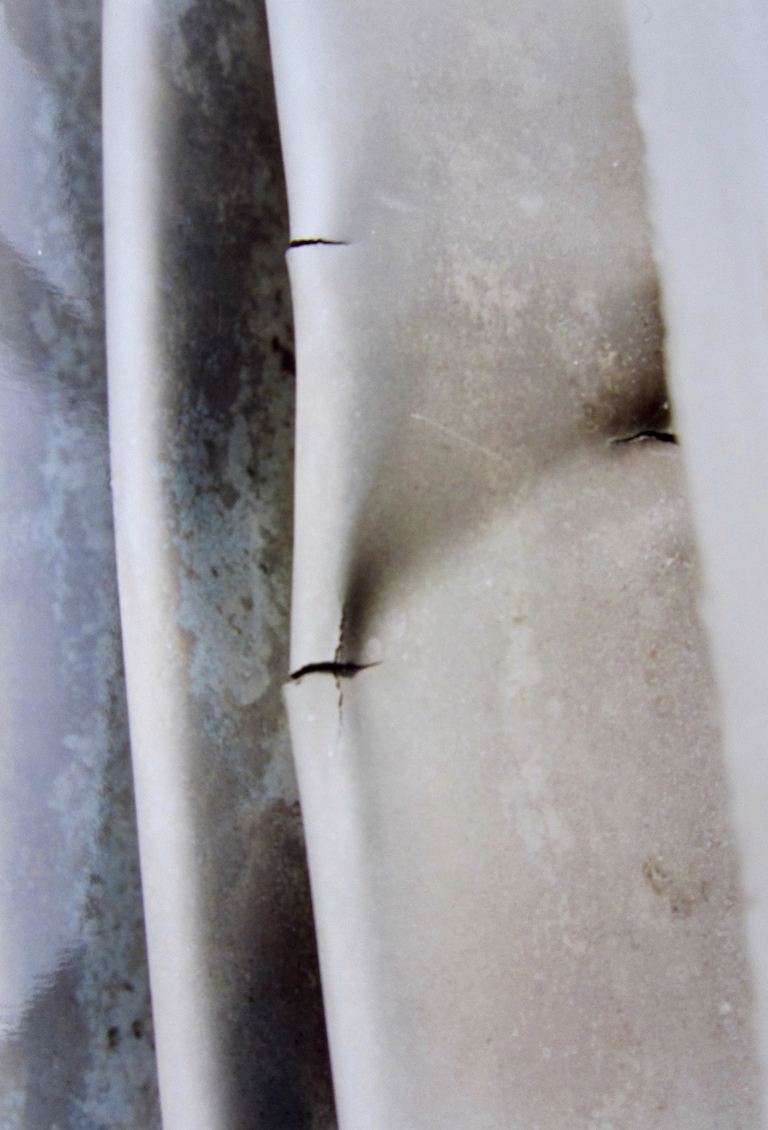
section epub:type=”chapter”> In Chapter 22, we saw that ions (or atoms) can diffuse down a concentration gradient, provided they are sufficiently mobile. This process was described by Equation (22.2), dc/dx is the concentration gradient in m− 4, J is the flux of ions or atoms (the number of ions or atoms diffusing down the concentration gradient per second per unit area) in m− 2 s− 1, and D is the diffusion coefficient in m2 s− 1. The same kind of equation can be used to describe the fact that heat flows down a temperature gradient (see Figure 32.1), dT/dx is the temperature gradient in K m− 1, q is the heat flux (the heat flowing down the temperature gradient per second per unit area) in J m− 2 s− 1, and K is the thermal conductivity in W m− 1 K− 1 (W = J s− 1). We have already looked at one application of thermal conductivity in Section 30.3—the conduction of heat away from the sliding surfaces between snow and skis (or snow and sledge runners). We saw another example in Section 17.4, where we used thermal insulation materials (polymer foam and mineral wool) to slow down the rate of heat transfer from the environment to liquid methane at − 162°C. K is a critical parameter in a vast range of applications, from thermal insulation in buildings to heat shields for spacecraft. Equation (32.2) describes the one-dimensional flow of heat through a solid under steady-state conditions—the temperature at any given point within the solid does not change with time (as in Section 17.4, for example). Under nonsteady-state conditions, the temperature at any given point within the solid does change with time (see Figure 32.2), and the heat flow equation becomes where t is time, and λ = K/ρC is the thermal diffusivity of the material. It has dimensions of m2 s− 1. ρ is the density in kg m− 3, and C is the specific heat in J kg− 1 K− 1. We can derive Equation (32.3) quite simply, by looking at Figure 32.2. We take a volume element of 1 × δx (the “1” is because the cross section of the conducting bar has unit area). In time δt, an amount of heat qin δt enters the volume element from the left-hand side, and an amount of heat qout δt leaves the volume element from the right-hand side. qin δt > qout δt, because the temperature gradient entering the element is greater than leaving the element. The difference in heat, qin δt − qout δt goes into warming up the volume element by amount δT, in other words some of the heat passing through the solid is “diverted” into heating it up. The equation for this is The density term is needed because we are calculating the heat required to warm up a volume, not a mass (C on its own can only be used for a mass). ρC has units of J m− 3 K− 1. Cross multiplying, From Equation (32.2), Substituting for (qin – qout) leads directly to Equation (32.3). Approximate experimental values for K, C, and λ are shown in Table 32.1. These are generally measured at, or fairly close to, 300 K. Since K, C, and λ can change with temperature, in any thermal design problem it may be necessary to obtain experimental data for the particular temperature range under consideration. Some pure metals have large values of K (e.g., silver, copper, aluminum), but alloying with other metals usually reduces K considerably (e.g., some copper alloys, some high-alloy and stainless steels, nickel-based superalloys, Ti-6Al4V). K values for ceramics and glasses are generally two orders of magnitude less than for metals (although alumina, silicon carbide, and silicon nitride overlap with metals). K values for polymers are an order of magnitude less than for ceramics, and for porous materials another order of magnitude less again. There is much less variation in the specific heats, although polymers tend to have C values roughly two to four times those of other materials. λ values range from ≈ 10− 7 (polymers) to ≈ 10− 4 (some pure metals). (High-purity, natural diamond is an extraordinary outlier, with a K value five times, and a λ value ten times, those of copper or silver.) We saw in Chapter 22 (Section 22.2) that the atoms in a solid vibrate about their mean positions. At a given absolute temperature T, the thermal energy of a vibrating atom (kinetic energy + potential energy) is 3kT averaged over time (k = Boltzmann’s constant = 1.38 × 10− 23 J atom− 1 K− 1). We also know that R = NAk, where R is the gas constant (8.314 J mol− 1 K− 1) and NA is Avogadro’s number (6.022 × 10²³ atoms mol− 1). So the thermal energy of a mole of atoms is NA × 3kT = 3RT. The specific heat is defined by the equation where dT is the temperature rise caused by adding an amount of heat dQ to the solid. There are two distinct ways of adding heat—at constant pressure (dQP = CPdT) and at constant volume (dQV = CVdT). Heat added at constant volume all goes into increasing the thermal energy of the atoms. Heat added at constant pressure goes into increasing the thermal energy of the atoms and doing “pδV” work against the environment (the solid expands as it is heated up). This means that CP > CV. For a perfect gas CP − CV = R, which is a large difference (gases expand a lot when heated). However, for solids, CP = CV to very high accuracy. This makes life much simpler, because values of C for solids are determined under conditions of constant pressure, not constant volume (just try restraining the thermal expansion of a piece of metal!). This means that C should theoretically have the value C = dQ/dT ≈ 3R ≈ 3 × 8.314 ≈ 25 J mol− 1 K− 1 for one mole of atoms, e.g., for one mole of silver, copper, etc. Experimental values for pure metals at ≈ 300 K are very close to these theoretical predictions (see Example 32.4). Taking this argument one step further, one would expect that the value of C for a crystal with two species of atoms, e.g., sodium chloride, NaCl, or silicon carbide, SiC, would be twice as much, i.e., ≈ 50 J mol− 1 K− 1. C for NaCl at ≈ 300 K is 51 J mol− 1 K− 1, very close to this theoretical prediction. However, for SiC at 300 K, C is only 27 J mol− 1 K− 1. Thereafter, C rises rapidly with increasing temperature, and eventually levels out at ≈ 50 J mol− 1 K− 1 (the theoretically predicted value) at the much higher temperature of 1000 K. This type of behavior is general for crystalline solids. As shown in Figure 32.3, C = 0 at absolute zero (T = 0), then rapidly increases with T, and eventually levels out at ≈ 25 J mol− 1 K− 1 (for one mole of atoms) when T = TD. TD is called the Debye temperature, and is different for different materials. For nearly all metals, TD < 300 K, which is why the simple model of atomic vibrations produces good agreement with data measured at or above 300 K. The same is true for NaCl (TD ≈ 280 K). However, TD for SiC must be of the order of 1000 K, which is why the simple model fails to predict C at 300 K. The reason for this temperature dependence is that the atomic vibrations can potentially take place in a large number of discrete (quantized) energy levels. These energy levels are uniformly spaced in energy, with a gap between adjacent levels of hν (h is Planck’s constant, and ν is the frequency of vibration (see Equation (22.5)). The probability that a given energy level will be occupied is This equation has the same form as Equation (22.3). nhν is the energy of the nth energy level (the integer n is called the “quantum number”). As T increases, there is an increasing probability that the vibrations will occur in higher energy levels, so the average energy of vibrations increases. At a sufficiently high temperature (= TD), the average energy of vibrations levels out at an upper limit of kT for each of the (three) independent directions of vibration (i.e., 3kT in total). When heat “flows” down a temperature gradient, it is because thermal energy is being “transported” through the solid. There are two transport mechanisms. The first (which occurs in all materials) relies on the thermal vibration of the atoms (or ions, or molecules) in the solid, which we have already used to explain specific heat (see Section 32.3). The vibrations produce “waves” of atomic displacement, which travel through the solid at the velocity of sound. We have already seen (Section 3.5) that the wave velocity is ≈ (E/ρ)1/2 for longitudinal waves, and (G/ρ)1/2 for transverse waves. These waves also behave like particles (having momentum), and are termed phonons (by analogy with electromagnetic waves and photons). As the phonons travel through the solid, they collide with other phonons, and also with imperfections (in a crystalline solid, these could be vacancies, dislocations, dissolved atoms, grain boundaries, precipitates, free surfaces). The phonons “dump” their energy where they collide, and this is how thermal energy is transported down the temperature gradient. K is roughly proportional to the velocity of the phonons, and to the average distance the phonons travel before they collide (their “mean free path”). Diamond is an electrical insulator, so heat is only transported by phonons. The very large K for high-quality natural diamonds (2500 W m− 1 K− 1) is due to two things. First, E is very large, at 1000 GN m− 2 (see Table 3.1). So also is G (≈ 3E/8, see Equation (3.9)). ρ (3.51 Mg m− 3) is quite small. So the phonon velocity (E/ρ)1/2 or (G/ρ)1/2 is large. Second, a high-quality natural diamond is a very slowly grown single crystal. It has no grain boundaries, few dislocations, and few dissolved atoms. So the phonons transport heat fast, and their mean free path is dominated by phonon-phonon collisions. Epoxy resin is an electrical insulator, so again heat is only transported by phonons. It has a small value of E (≈ 3 GN m− 2, see Table 3.1) and a small value of ρ (≈ 1.2 Mg m− 3, see Table 5.1). The phonon velocity in epoxy is ≈ 1/10th of that in diamond. But K for epoxy (≈ 0.2 W m− 1 K− 1) is 12,500 times less than for diamond, not 10 times less. This implies that the phonon mean free path in epoxy must be of the order 103 times less than in diamond. Given the disorder associated with the amorphous crosslinked structure of epoxy, this is not surprising. In particular, the crosslinks are very effective at stopping the propagation of phonons, so we would expect a mean free path of the order of the distance between crosslinks, i.e., a few nm. In turn, this suggests that the mean free path in diamond is of the order of a few μm.■ The second transport mechanism (which occurs in electrically conducting materials, mainly metals) relies on the conduction electrons in the material. We saw in Section 4.2 (Figure 4.8) that the conduction electrons in metals form a “sea” of electrons, not strongly attached to the metal ions. Obviously, when an electric field is applied to these electrons, they “flow” up the voltage gradient (remember that an electron has a negative charge), and this is the origin of the electrical conductivity of the metal. The electrons also have thermal energy. This is all in the form of kinetic energy (the electrons are not in a potential well, so have no potential energy). The thermal energy is half of that for a vibrating atom (which has both kinetic and potential energy), and is therefore 3/2 kT averaged over time. Electrons flow down the temperature gradient, carrying kinetic energy with them, until they collide with phonons or defects, where they “dump” their kinetic energy. In a pure metal, the mean free path is of the order of 50–100 nm. In a very impure metal (alloy), the mean free path is much smaller, and so is the thermal conductivity. In a pure metal, electrons transport nearly all the heat flow. In a very impure metal (alloy), electrons and phonons transport similar amounts of heat. It is therefore not surprising that materials, which are good thermal conductors, are also good electrical conductors. Pure copper has a K value of 397 W m− 1 K− 1 (see Table 32.1), and an IACS electrical conductivity of 102%. When copper is alloyed with 2% beryllium and heat treated, very fine precipitates of a strong copper-beryllium compound form. In this condition, the tensile strength is increased from 300 MN m− 2 (fully work-hardened pure copper) to the astonishingly high value of 1400 MN m− 2 (see Section 11.4 for the reason why). The presence of precipitates, dissolved Be, and small grain size reduces both the thermal and electrical conductivities (to ≈ 95 W m− 1 K− 1 and ≈ 20% IACS). The thermal and electrical conductivities decrease by factors of around 4 and 5. High-strength Cu-Be is much used for molds for plastics injection molding. Its great hardness means reduced wear and long life, but it still has a large enough thermal conductivity to conduct heat away quickly from the molten plastic (which means short cycle times, and fast throughput). In contrast, a low-alloy steel of comparable strength would have a K value of only ≈ 33 W m− 1 K− 1, ≈1/3 that of Cu-Be. Figure 32.4 shows the expansion bellows from the hot end of a heat exchanger. The bellows sits around the hot tubeplate, which measures 2900 by 1600 mm. Pure gas at 800°C is fed through the tubes, and contaminated gas at 600°C is passed over the outside of the tubes. The bellows is meant to absorb the large axial thermal expansion of the tubes when they are heated up from ambient temperature to the average operating temperature. The bellows unit has suffered major distortion. The material is 304 stainless steel. 304 is used because it resists high temperature oxidation and creep, can be welded, and is cheap. However, Table 32.1 shows that stainless steels have a low value of thermal conductivity, in the range 12–45 W m− 1 K− 1. 304 (K = 15 W m− 1 K− 1) is at the lower end of this range. For comparison, K for copper is 397 W m− 1 K− 1, 26 times greater. The thermal diffusivity of 304 (4 × 10− 6 m2 s− 1) is 30 times less than that for copper (1.2 × 10− 4 m2 s− 1). These low values of K and λ make 304 very prone to thermal distortion. When the heat exchanger is brought on stream, the bellows unit is not heated evenly. It takes a long time to reach thermal equilibrium, and during this time there are large differences in thermal expansion from one location to another, which are relieved by distortion. Figure 32.5 is a close up of the bellows, showing pronounced local distortion at the peaks of the convolutions. Repeated thermal cycling at these locations has resulted in cracking—another example of thermal fatigue. The opposite problem occurs in copper, as when silver soldering or brazing large copper components together. There is a good example in our companion text Engineering Materials 2—silver soldering a copper boiler for a model steam engine (see Chapter 1). The problem here is that when you aim the gas torch at the seam to be soldered, the heat just vanishes into the bulk of the boiler, because K for copper is so large. It is virtually impossible to produce any thermal distortion; the problem is getting the seam up to the required temperature (around 610°C). You first have to “back-fill” the rest of the boiler with heat, warming it all over with a large gas torch, and then covering it with hot lumps of firebrick to keep it warm. Only then can you successfully heat the seam itself. When unlubricated surfaces slide over one another, work is done, and heat is produced at the sliding interface (see Chapters 29 and 30). If the heat is not conducted away into the parent materials, then the temperature at the sliding interface will increase rapidly. We have already seen when there is a lubrication failure in a journal bearing, this can rapidly lead to partial melting of the bearing metal (see Figures 30.5 and 30.6). In this bearing, the steel shaft and the white metal bearing did not have a large enough K to conduct sufficient frictional heat away from the sliding interface. There are many other examples of this effect. If you go sailing, you will know that you should always wear gloves (the sort which have the finger tips cut off, to allow you to tie knots or undo shackles). DRHJ once suffered rope burns to his hands while helping to moor a 29-ft classic racing yacht before putting his sailing gloves on. The mooring rope slipped just a few inches through his hands, and the frictional heat caused the burns. It was not that the rope caused wear of the skin, it was because the heat generated at the sliding interface burned the skin. Both polymer-fiber rope and human flesh are poor conductors of heat, so the frictional heat was not conducted away. The same is true in rock climbing or mountaineering—always wear gloves, or you may lose some of your skin if you have to arrest a fall. But there is a worse hazard. Climbers know they must never, ever, run a climbing rope through a polymer-fiber sling (e.g., at a belay point). They must always run it through an aluminum alloy carabiner. The reason is that if you run a climbing rope through a sling, and you have to arrest a fall, the frictional heat between the rope and the sling will not be conducted away, and it can actually melt through the sling, usually with fatal consequences. (DRHJ does not know whether, having arrested a fall, the frictional heat absorbed by the carabiner is capable of melting the climbing rope itself once it has come to a stop. He presumes it does not.) In the aerospace field, some airplanes now have video cameras mounted beneath the fuselage, which give passengers a real-time view on their screens. On landing, you can see the nose wheel make first contact with the runway, and you can also see the usual “puff of smoke” coming from the wheels. Until the wheels have been accelerated to runway speed, there is (often dry) sliding between tires and runway, which generates frictional heat; this is not dissipated sufficiently into the (low K) materials of tire and runway, and burns the surface of the tires. And if you have ever been behind a heavy truck when it has braked sharply, you will likely have seen smoke coming from those wheels, too. Drivers of fast cars are not the only people who “burn rubber.” Finally, it is sometimes useful to retain frictional heat at a sliding interface. Safety matches would not light without it; and ancient cultures have known for countless millennia that fire can be started using frictional heat (e.g., the “bow and rotating spindle” method, which utilizes the low thermal conductivity of the wooden spindle and block). The traditional material for outdoor seating in public areas is wood (see Figure 32.6). These feel “warm” when you sit on them, even on a cold day. They are also made from a sustainable material. However, “modern” municipal authorities often provide seating made from steel or aluminum instead (see Figure 32.7). Such seating feels very “cold” when you sit on it, particularly if it is made from aluminum. Perhaps the authorities want people to move on quickly. Or perhaps they are ignorant of the large differences in the thermal properties of wood, steel, and aluminum (see Table 32.1). If you must use a “modern” material, choose a polymer instead (see Table 32.1). Alternatively, you could always carry a newspaper with you, and sit on that—layered paper is a good thermal insulator. In Equation (22.13), we saw that the distance that atoms diffuse over a period of time t is given by In the same way, the distance that heat flows over a period of time t is given by. We can compare the heat flow distances into aluminum and wood over a given time t by the ratio. To warm up a volume of material Ax, where A is the surface area, requires heat of amount AxρCΔT to be input at the surface (ΔT is the average temperature rise of the volume). So. (the values of A and ΔT cancel out). Using values from Table 32.1, we get. In other words, over the same time period, an aluminum bench takes 78 times more heat from a sitting person than a wooden bench—no wonder it feels cold! You can run the comparison for steel versus wood (ratio = 48), or polycarbonate versus wood (ratio ≈ 1). So steel is not much better than aluminum, but polycarbonate is as good as wood.
Thermal Conductivity and Specific Heat
32.1 Introduction
Worked Example 1
32.2 Thermal Conductivities and Specific Heats
32.3 Physical Basis of Specific Heat
32.4 Physical Basis of Thermal Conductivity
Worked Example 2
Worked Example 3
Worked Example 4
32.5 Case Studies
Distortion and cracking of a heat exchanger
Getting rid of frictional heat
Seats that feel “warm” and seats that feel “cold”


Worked Example 5
Examples
Answers