CHAPTER 11
Evaluating the Effect of an Amputee’s Physical Parameters of Pressure on a Lower-Limb Prosthetic Socket Using a Fuzzy-Logic-Based Model
1Assistant Professor, Department of Mechanical Engineering, Manipal University Jaipur, Dehmi Kalan, Jaipur – 303007, Rajasthan, India
2Professor, Oriental Institute of Science and Technology, Bhopal, Madhya Pradesh, India
3Assistant Professor, Department of Mechanical Engineering, The LNM Institute of Technology, Jaipur, Rajasthan, India
11.1 INTRODUCTION
Over the past few years, the requirement for implants and medical devices in orthopedics has undertaken rapid growth due to some important factors including growing elderly population, technology developments, the rise in chronic diseases, and improved healthcare facilities in developing countries. Currently, there are more than 30 million people worldwide having amputations [1] and most of them involve the lower limb at the transtibial level [2]. With the help of prosthesis, amputees can improve the quality of life. The amputation rate in developing countries, including India, is about 45% of diabetic foot problems, with an estimated 50,000 amputations occurring per year [3]. The prosthetic socket act as a critical interface between amputation and residual limb, which is designed and developed in an iterative process by the prosthetist.
Regardless of the use of advanced technologies in socket manufacturing, definite stump-socket interaction takes place. This interaction results in excessive stresses, patient discomfort in wearing the prosthesis, pain, skin irritation, pistoning, and stump soft tissue damage [4]. It is accepted that the superiority of the socket fit is directly related to the pressure distribution produced at the residual limb-socket interface. The quality of the socket fit is considered to be good if the total load is supported by the pressure tolerant areas (e.g., areas of thick tissue) of the limb. The pressure-sensitive areas (e.g., areas where the bone is close to the surface) should be non-load bearing for a better comfort. Currently, it is forecasted that 20 present of prosthetic sockets fabricated are either discarded due to improper fitting or significantly require modification to ensure satisfactory ‘fit,’ signifying knowledge gap in procedures. The amputee discomfort and pain occurs due to high-pressure interaction at the stump-socket interface, which is one of the important factors to be considered in the area of prosthetics and orthotics. For the reason above, the determination of pressure distribution is useful in effective socket design and development. Additionally, the determination of pressure distribution at the stump-socket interface proves to be an effective parameter to enhance the quality of the socket fit [5].
The transducers have been used for pressure assessment purposes since late 1970 [6]. Several researchers have studied and investigated about force, pressure, displacement, strain, normal, and shear stress at the stump-socket interface [4, 7] using a diaphragm strain gauge, piston-type strain gauge, capacitive, piezoresistive based sensors [8, 9]. Most of the investigators prefer to use piezoresistive sensors such as force sensing resistors (FSR) due to their eminent features including the small size with a simple structure, thin construction, adequate flexibility, good sensitivity, and ease of use [10, 11]. In comparison to other sensors that could be either positioned within prosthetic sockets or mounted on socket wall, all piezoresistive sensors are very thin sheets; ideal to be positioned in-situ inside the prosthetic socket. The accurate pressure measurement required a suitable measurement technique, appropriate sensor; correct positioning of the sensor at the stump-socket interface. A suitable pressure measurement system should be able to produce actual results without changing the initial stump-socket interface condition. Pressure measurement help in the realization of the intricate problems confronted during a socket fitting.
Presently researchers are more focused on determining novel bio-materials for socket manufacturing and further integration of advanced tools like reverse engineering, CAD, and FEM to produce accurate virtual model development and pressure measurement [12–14]. The past research concluded that transducers are applicable for gathering pressure data in limited regions within the prosthetic socket. FEM requires detailed information of the patient’s limb and socket geometry and material properties that is not available for each patient. The aforementioned studies have provided results that deal with the aid in understanding the critical issues faced in socket fitting. It is also found that advanced tools are needed to overcome the limitations of the traditional socket fitting process, providing practical results helpful for clinical significance [15, 16].
In presently available methods of pressure measurement, the pressure can be measured either by sensor introduction into the socket/limb interface, which affects the results collected or by altering the socket to insert the pressure transducer, leading to difficulties in daily use. For overcoming these drawbacks, a computational approach will be beneficial in predicting the pressure at the socket interface. For this reason, a fuzzy logic-based artificial intelligence model have been proposed for the determination of pressure under different conditions, i.e., static, and dynamic. In the field of prosthetics and orthotics, no work is available on applying the fuzzy logic model in pressure measurement and evaluation at the socket interface.
Soft computing techniques have the ability to describe non-trivial complex problems where input and output relations are non-linear. Soft computing techniques such as Fuzzy logic, ANN, evolutionary, and nature-inspired algorithms provide an adequate solution to the variety of complex problems, while acknowledging the uncertainty involved in the problem [17]. Fuzzy logic is effective when an accurate mathematical model is not available, can work with imprecise inputs, and at last can handle the non-linearity with ease. Therefore, in the present study, the authors have selected fuzzy logic technique to model pressure measured at different specific regions in terms of amputee physical parameters. The capability to model the relations amid the different loading conditions and pressure effects on the residual limb would provide an enhanced tool for examination and aid clinicians to analyze socket discomfort issues. It would also enable research on socket interface design and material and will help clinicians in advising involvements for amputees with complex residual limbs. Determining the influence of amputees’ physical parameters on real-life pressure values at the socket will aid the prosthesis to better design ensuring the comfort of the amputees.
11.2 MATERIALS AND METHODS
Ten unilateral below-knee male amputees have been selected for the acquisition of pressure data for this investigation. The details of the amputees are given in Table 11.1. This study considered clinically in different cases. The selected amputees regularly used a prosthesis patella tendon bearing (PTB) socket with a uniform thickness of 5 mm with cotton liner. They had been using exo-skeletal transtibial prosthesis from the last 3 to 21 years with PTB socket manufacturing in Bhagwan Mahaveer Viklang Sahayata Samiti (BMVSS), Jaipur, India. The measurements have been carried out using the Flexi-Force sensor as shown in Figure 11.1.
TABLE 11.1 General Information about Patients
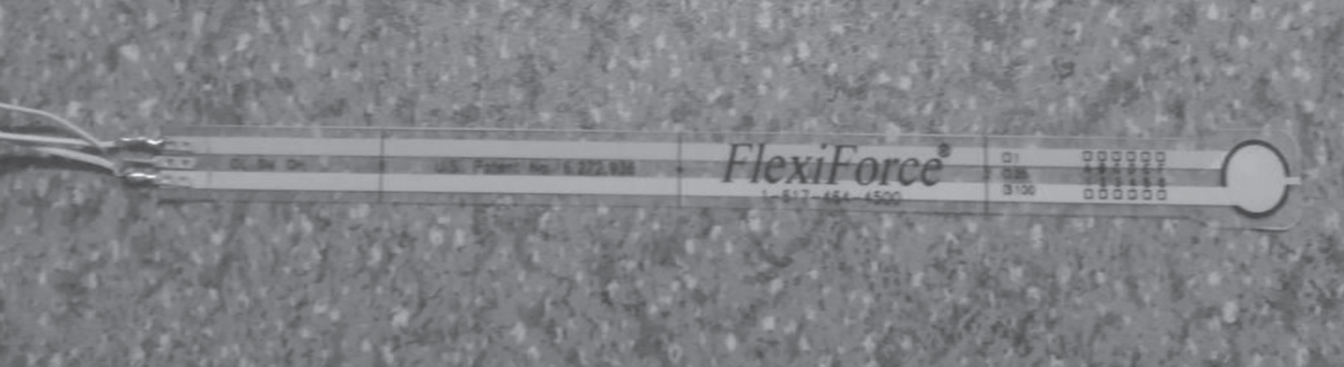
FIGURE 11.1 Flexi-force pressure sensor.
The characteristics of the flexi-force sensor are listed in Table 11.2. The sensor is of small thickness, flexible printed circuit, lightweight custom shape, and size. It can measure the force between any two contacting surfaces and is durable enough to stand up in most environments with a force range (0 to 445 N). These sensors can be easily integrated into the stump-socket interface. The sensor measure both static and dynamic forces between stump and socket. It is constructed from two layers of the substrate; this substrate is composed of polyester film (or polyimide in the case of the high-temperature sensors). On each layer, a conductive material (silver) is applied, followed by a layer of pressure-sensitive ink sensor. The adhesive is then used to laminate the two layers of substrate together to form the sensor. The sensor acts as a variable resistor in an electrical circuit. When the sensor is unloaded, its resistance is very high (greater than 5 MQ); when a force is applied to the sensor, the resistance decreases.
TABLE 11.2 Characteristics of Flexi-Force Standard Model A201
| Sl. No. | Parameters | Value | Unit |
| 1. | Thickness | 0.208 | mm |
| 2. | Length | 197 | mm |
| 3. | Width | 14 | mm |
| 4. | Sensing Area | 9.53 | mm |
| 5. | Force Range | 0–445 | N |
11.3 EXPERIMENTATION AND DATA ACQUISITION (DAQ)
The experiments have been carried out on the amputees using an experimental setup as shown in Figure 11.2. One step-down transformer is used to convert an AC voltage of 220 V to 9–0–9 V. Analogue to digital converter (ADC) is used to converts an analog signal to digital. The result is a sequence of digital values that have been converted from a continuous-time and continuous-amplitude analog signal to a discrete-time and discrete-amplitude digital signal.
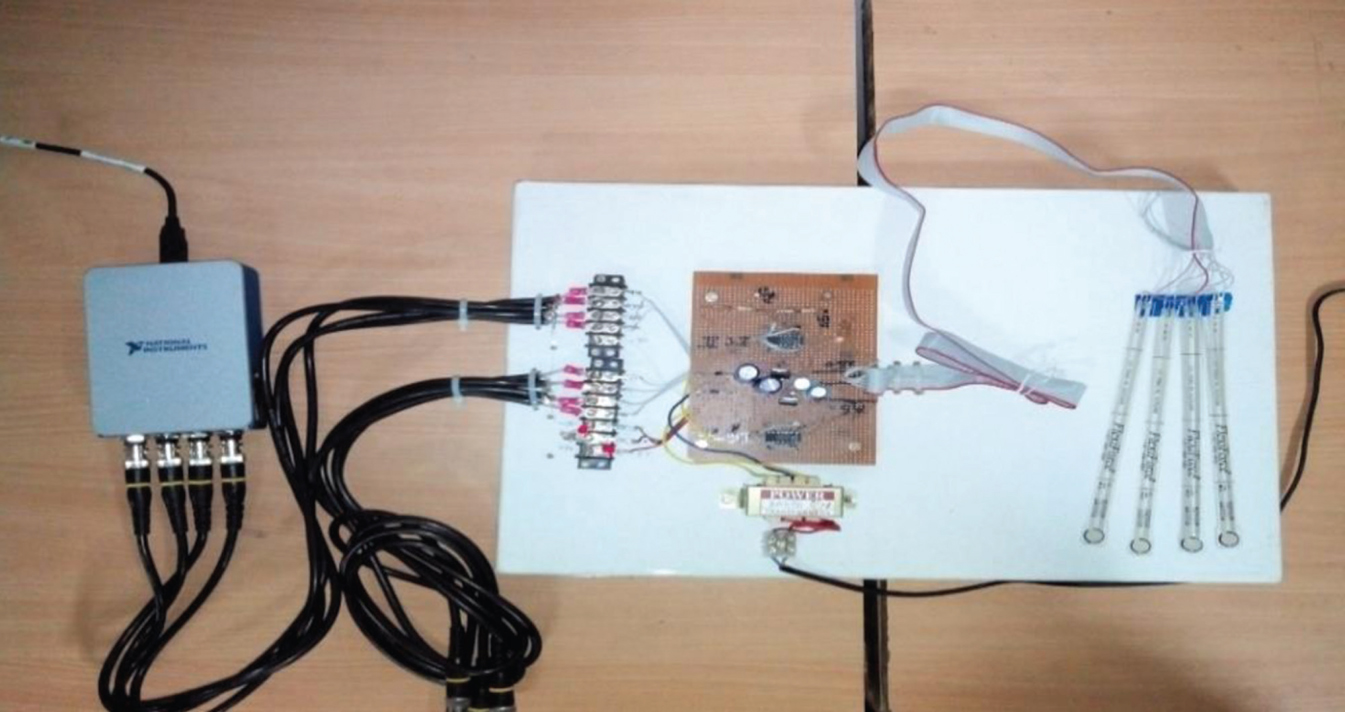
FIGURE 11.2 Flexi-force set up with a national instrument system.
One capacitor is used to stabilize the DC voltage. Resistance is used to drop the voltage. Then the experimental setup is connected to data acquisition (DAQ) block/card (DAQ-9171), four channels NI 9234 chassis (national instruments) by BNC probe cable to the virtual instrumentation software (Lab-view) for DAQ. DAQ is the process of measuring an electrical or physical phenomenon such as voltage, current, temperature, pressure, or sound with a computer. A DAQ system consists of sensors, DAQ measurement hardware, and a computer with programmable software. Compared to traditional measurement systems, PC-based DAQ systems exploit the processing power, productivity, display, and connectivity capabilities of industry-standard computers providing a more powerful, flexible, and cost-effective measurement solution. A Flexi-Force sensor is attached to the curved portion of the plastic frame, and the accelerometer board is mounted on its base of the oscillating mass. Flexible force sensor (FFS) system is ready to plug-n-play. The FFS works like any other bridge transducer, by converting non-linear resistance changes to a linear output voltage proportional to force. The calibration of FFS is performed by using the dead weights following standard calibration procedure. The accuracy and repeatability of measurements of FFS were analyzed. The static and dynamic loading tests were performed to obtain pressure sensing parameters. The linearity, repeatability, and hysteresis were found to be +/–4.5%, +/–4.1%, +/–6.1%. The drift was found to less than 5.6%.
In the current study, eight specific regions, as shown in Figure 11.3, have been identified to measure pressure at different loading conditions (half, full, and walking). The regions are Lateral Tibia (P1), Gastrocnemius (P2), PTB (P3), Kick Point (P4), Medial Tibia (P5), Medial Gastrocnemius (P6), Popliteal Depression (P7), and Lateral Gastrocnemius (P8). The interface pressure values have been recorded for two standing, viz. half body weight, and full body weight, for 50 seconds. For walking conditions, the amputee is asked to walk for 12 meters distance. Before initiating a measurement, all hardware components of the FFS system (socket, connecting the cable, converter) must be appropriately connected. The FFS is placed between the liner and socket at eight specific regions. Further, a pressure measurement at all eight regions can be viewed simultaneously in real-time using the software on a laptop/PC screen, and the measurement can be repeated if required.
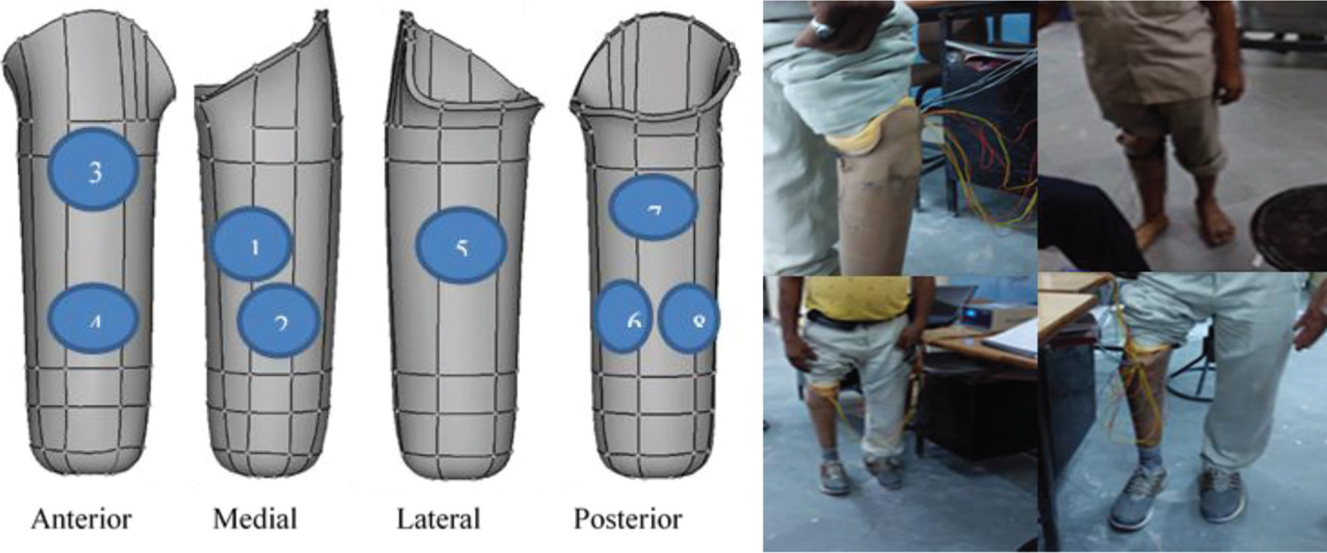
FIGURE 11.3 The pressure points (Left) and fitting of the sensor (Right) on the limb.
The measured values of pressure at the eight specific regions are presented in Table 11.3. For this study, three trials were performed, and an average of the pressure data is selected and reported. The maximum pressure at all the three (walking, full, and half) conditions are shown in bold. From Table 11.3, it has observed that the strongest impact of maximum pressure between stump-socket interfaces is on the PTB.
TABLE 11.3 Static and Dynamic Pressure (KPa) Data Using Flexi-Force Sensor
11.4 FUZZY LOGIC
Fuzzy logic is a multi-valued continuous system providing intermediate values to be defined between conventional evaluations such as true or false, yes or no, and high or low as was used in binary logic. The concept of fuzzy logic has its inception in 1965 by L. A. Zadeh. In fuzzy logic, the available data is represented in the terms of linguistic variables and reasoning, which is easy to apprehend and interpret [18]. The fuzzy logic has extensive application areas and scope of work, due to its suitability to be used as an effective inference system. Such fuzzy inference systems do not only consider two alternatives, instead it takes complete truth space for logical reasoning and propositions. The fuzzy inference system provides middle values to be established between traditional yes or no solutions [19]. In engineering applications, the fuzzy inference system utilizes this incessant subset membership function to transform crimped numerical problems into fuzzy linguistic regions. Fuzzy inference system makes use of conventional linguistics to state variables and fuzzy language procedures to define associations as opposing to employ with numeric variables and mathematical functions. In contrast to the mathematical expression, fuzzy logic offers to use amassed knowledge and experience based on practice rather than theory form. By sustaining the physical inference and effects of all variables, fuzzy logic simulates the complex and nonlinear systems. It is observed that very few works is available in literature which attempts to model pressure at different specific points in terms of patient physical characteristics. Therefore, the present study employed fuzzy logic to model the magnitude of a response variable, such as intra-socket pressure, changes with the values of the independent casual variables, such as weight, height, and SL (for amputee).
The fuzzy membership function characterizes the degree of association between input and output linguistic variables which are represented in Table 11.4. The linguistic terms for different input membership functions are described low (L), medium (M), high (H). Similarly, the output response of pressure is fuzzified in fuzzy sets as very low (VL), low (L), medium (M), high (H), and very high (VH). The membership function and the connected linguistic variables were determined based on the available literature.
TABLE 11.4 Fuzzy Linguistic Term Characteristics
| Factors | Linguistic Term | Range |
| Weight (A) | Very low (VL), low (L), medium (M), high (H), and very high (VH) | 52–72(Kg) |
| Height (B) | Very low (VL), low (L), medium (M), high (H), and very high (VH) | 162–175 (cm) |
| Stump Length (C) | Very low (VL), low (L), medium (M), high (H), and very high (VH) | 15–28 (cm) |
| Pressure at Point 1 (P1) | Very low (VL), low (L), medium (M), high (H), and very high (VH) | 21–162 (KPa) |
| Pressure at Point 2 (P2) | Very low (VL), low (L), medium (M), high (H), and very high (VH) | 10–210 (KPa) |
| Pressure at Point 3 (P3) | Very low (VL), low (L), medium (M), high (H), and very high (VH) | 25–360 (KPa) |
| Pressure at Point 4 (P4) | Very low (VL), low (L), medium (M), high (H), and very high (VH) | 25–245 (KPa) |
| Pressure at Point 5 (P5) | Very low (VL), low (L), medium (M), high (H), and very high (VH) | 24–250 (KPa) |
| Pressure at Point 6 (P6) | Very low (VL), low (L), medium (M), high (H), and very high (VH) | 22–212 (KPa) |
| Pressure at Point 7 (P7) | Very low (VL), low (L), medium (M), high (H), and very high (VH) | 20–260 (KPa) |
| Pressure at Point 8 (P8) | Very low (VL), low (L), medium (M), high (H), and very high (VH) | 15–225 (KPa) |
11.5 FUZZY MEMBERSHIP FUNCTIONS
The performance of different membership functions for the linguistic terms of input factors and output response was examined based on the least root mean square error (RMSE). From the commonly used membership functions such as triangular, trapezoidal, and Gaussian, this study employs triangular membership function for assessment of input variables and triangular type functions are chosen for output variables as shown in Figure 11.4. The triangular membership function for the output was defined using three parameters m, n, p with vector x:
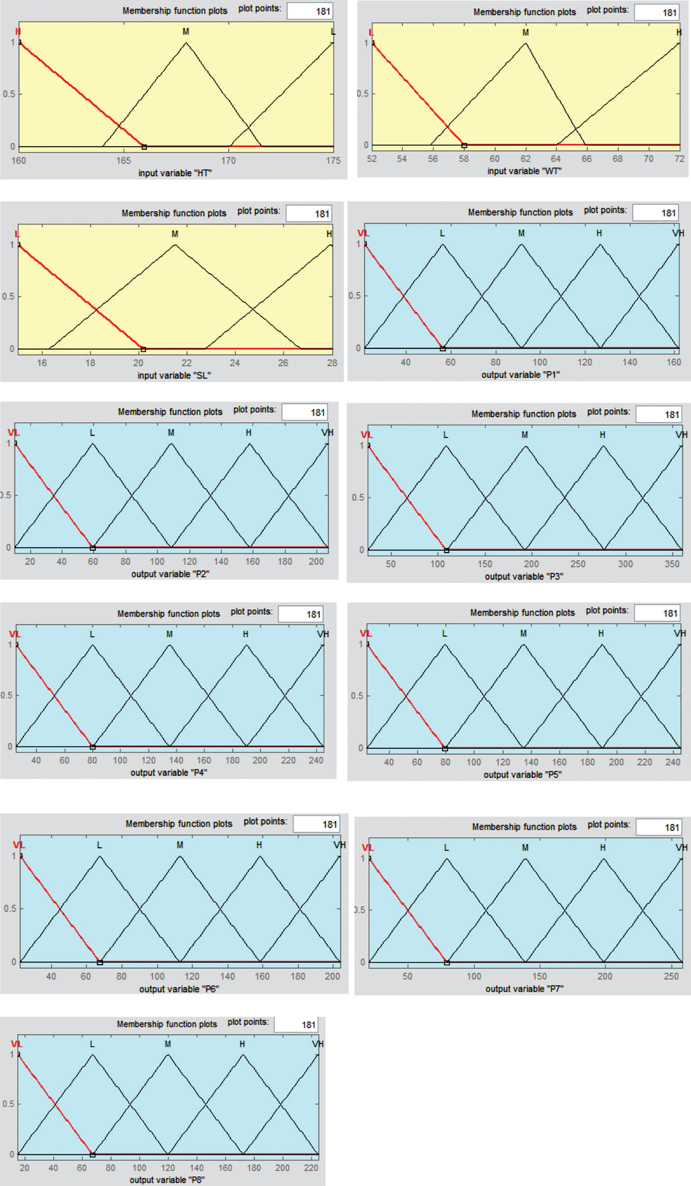
FIGURE 11.4 Triangular membership function for input and output.
 |
11.6 FUZZY RULE BASE
In this study, the membership function resulting from the expert is used to produce the fuzzy rule base. The Mamdani method of fuzzy rule base containing a set of if-then statements for 10 rules with three inputs, patient’s weight (A), height (B), and stump length (C) with eight outputs as the pressure at eight points (P1 to P8) are considered for all the three conditions (walking, half, and full). The easiness of the Mamdani model makes it a suitable candidate to be widely used in solving complex optimization and complicated manufacturing problems. The rules were recognized from the experimental trials performed in Table 11.1.
11.7 DEFUZZIFICATIOIV
The defuzzification process was performed to obtain fuzzy output and transform fuzzy set data into numerical data value. For defuzzification, a commonly employed method of the centroid of gravity (COG) is used to convert fuzzy membership function to the crisp or precise output of a particular data pair. Due to the wide acceptance, easiness, and applicability to produce precise results, the COG method is applied, which can be expressed by the below formula:
 |
where x* represents the center of gravity location along the x-axis. The fuzzy rule viewer is graphically represented as shown in Figure 11.5. The rows represented individual fuzzy rule and the first three columns depict the input desirability. The last eight columns represent the defuzzified output of pressure at different specific regions.
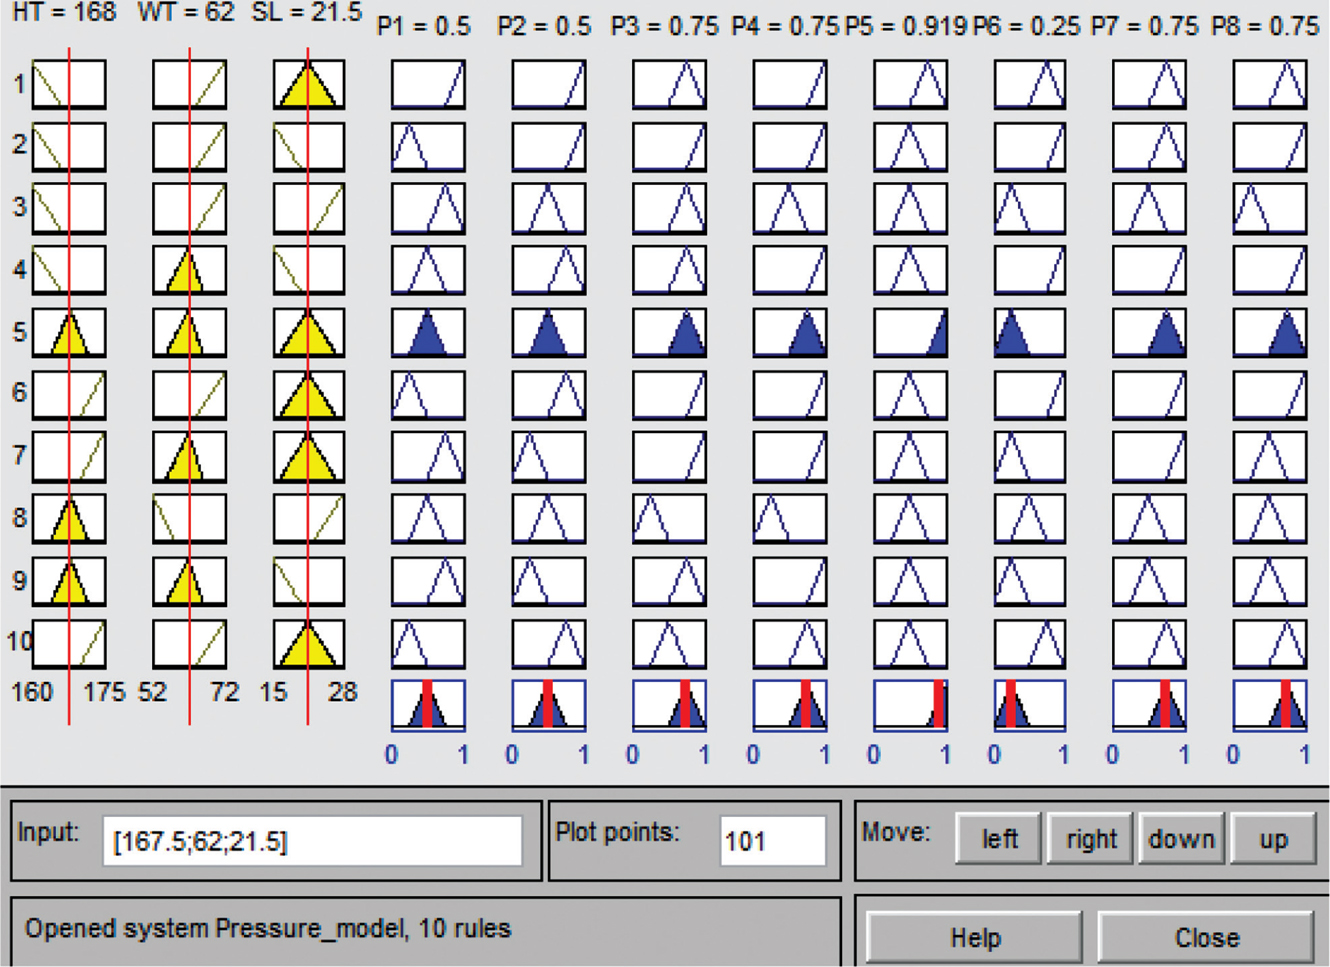
FIGURE 11.5 Graphical representation of fuzzy rule.
11.8 RESULTS AND DISCUSSION
From the experimental results, it is clear that the strongest impact of maximum pressure between stump-socket interfaces is on the PTB (point 3). Therefore, the surface plot predicted by the fuzzy-based model for PTB at point 3 is shown in Figure 11.6. Figure 11.6 depicts the variation of pressure in terms of different physical parameters of an amputee. It can be shown from Figure 11.6 that for 60–65 kg patient weight combining with a higher value of SL is providing maximum pressure of 270 KPa. Similarly, the 60–65 kg weight patients along with the height in the range of 170–175 cm provide a maximum pressure of about 330 KPa. Moreover, the final plot shows that with the height of the patient in the range of 170–175 cm with SL of over 20 cm can produce the maximum pressure of approximately 330 KPa.
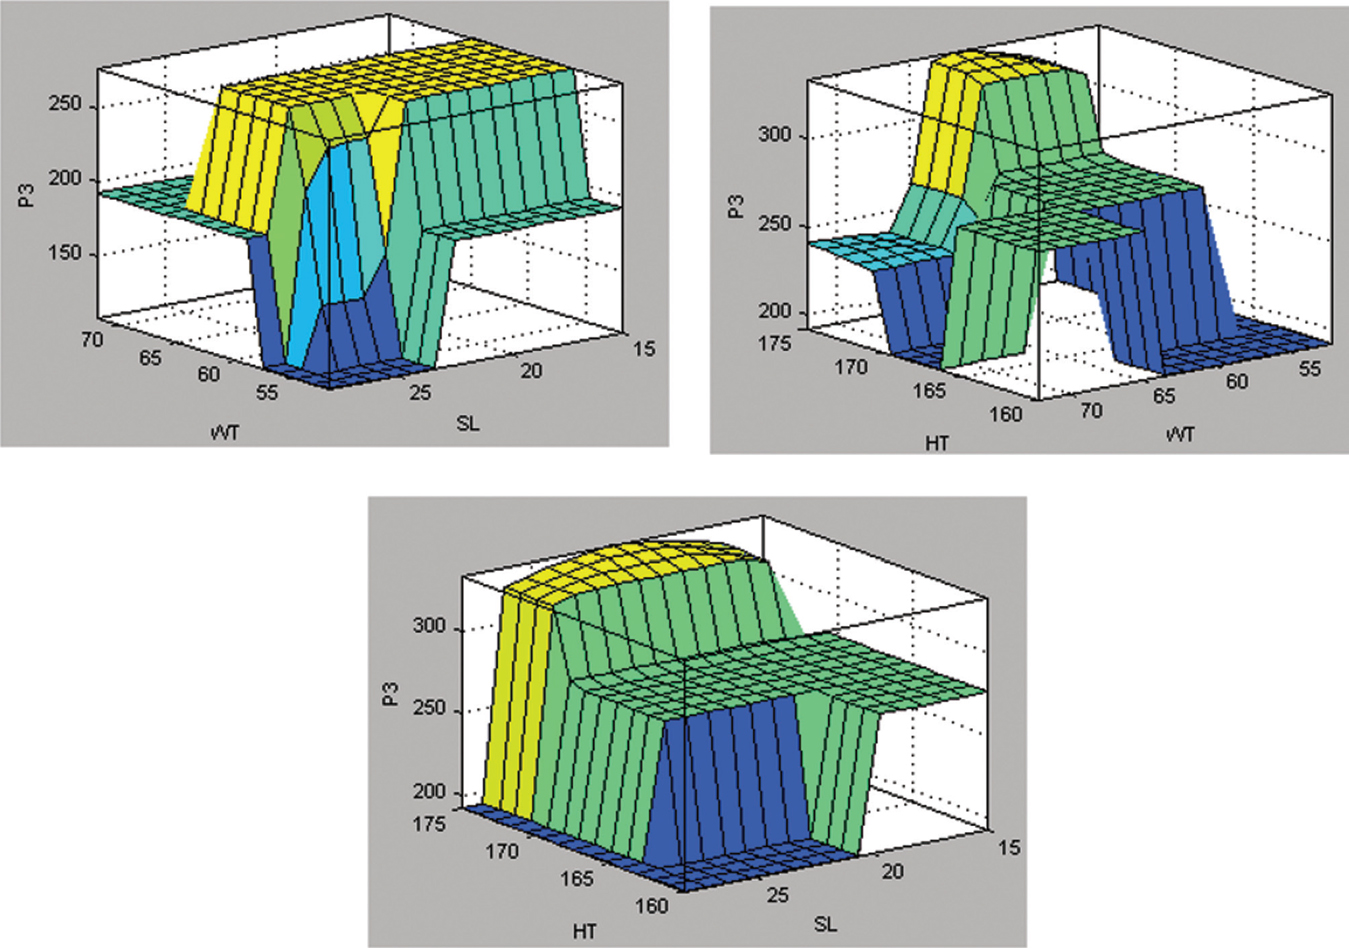
FIGURE 11.6 Predicted pressure at point 3 for different combinations of input parameters.
In the present study, the pressure at different loading conditions is mathematically formulated using the regression analysis technique [20]. Further-more, regression analysis is carried out on the experimental data collected from the ten patients (Table 11.5) using statistical software Minitab 16. The pressure for three loading conditions was expressed as a function of weight (WT), SL, and height (HT) as shown in Eqs. (11.1)–(11.3).
 | (11.1) |
 | (11.2) |
 | (11.3) |
The analysis of variance (ANOVA) test was executed to statistically investigate the established models for three loading conditions. ANOVA results for the walking condition response model are tabulated in Table 11.5. The ANOVA results for the walking load with model F-value of 20.9 suggest that the model is significant. There is only a 0.01% chance that such a higher model F-value may have happened due to noise. The higher value of the determination coefficient (R = 91.28%) and adjusted determination coefficient (adjusted R = 86.93%) signifies that the model does not clarify only less than 8.72% of the total variation. Hence, this model can be used to navigate the design space.
TABLE 11.5 ANOVA Results for Walking Load Condition
Table 11.6 shows the ANOVA results for the full load condition response. The ANOVA results for the full load response with a model F-value of 18.1 implying that the model is significant. There is only a 0.01% chance that such a higher model F-value may have occurred due to noise. The higher value of the determination coefficient (R = 90.07%) and adjusted determination coefficient (adjusted R = 85.10%) signifies that the model does not clarify only less than 9.93% of the total variation. Hence, this model can be used to navigate the design space.
ANOVA results for the half load condition response model are listed in Table 11.7. The model F-value of 10.9 with P-value <0.01 implies that the developed model is significant. There is only a 0.01% chance that such a higher model F-value may have occurred due to noise. From Table 11.7, the higher value of the determination coefficient (R = 84.56%) and adjusted determination coefficient (adj. R = 76.84%) signifies that the model does not clarify only less than 15.44% of the total variation. Hence, this model can be used to navigate the design space.
TABLE 11.6 ANOVA Results for Full Load Condition
TABLE 11.7 ANOVA Results for Half Load Condition
The accuracy and error percentage determination is a prerequisite for validating newly developed prediction models to know how close the predicted value is from the measured experimental value. In the same context, to check the accuracy and individual error% of the developed fuzzy model in predicting the pressure values is compared with the experimental value at different regions of nine patients (see Table 11.8). The variation of predicted values (Em) from the actual measured experimental value (Ef) are used to calculate error percentage (EP) after dividing the absolute difference between the above values by the measured experimental value.
 |
Furthermore, the accuracy is calculated by determining the closeness of the predicted fuzzy model value to the measured experimental value. The below equation is used, where Am is the accuracy of the model and n is the total number of considered datasets for finding the average individual accuracy.
 |
The predicted and measured values of output responses were utilized for the determination of error and accuracy percentage of the applied fuzzy logic model. The highest and lowest error percentage between measured and predicted fuzzy model results for P1–P8 points are 11.57 and 0.11 respectively. Such a consistent and lower error percentage of the overall model specifies that the fuzzy model predicted the outcome which is in close proximity with the experimental results. It is worth noting that the overall model accuracy comes out to be 98.54% in predicting the values of pressure at different points of reconstructed surface. Such high overall model accuracy justifies the utilization of a fuzzy model for successful prediction of output response of pressure at different specific regions in terms of patient physical parameters making it suitable for socket fit.
From the Fuzzy logic-based model for walking load conditions and regression equations fitted for half load, full load, and walking load conditions, it can be said that weight and SL of the patient will affect the pressure developed at the socket interface. Overall, it has perceived that the developed pressure is maximum for the walking condition as compared to full load and half load conditions. It is obvious that while walking condition, the amputee will exert maximum effort and thus the exhibiting maximum pressure at limb/socket interface. The most important outcome of results is that amputee’s weight is a most important factor that attributes in determining the amount of pressure at transtibial prosthetic limb/socket interface. The pressure will increase with an increase in amputee’s weight. The pressure essential to bear the amputee’s weight on a socket would be sovereign of the surface area of the stump/socket interface.
TABLE 11.8 Accuracy and Error Percentage Results
11.9 CONCLUSIONS
A methodology has been developed using the low-cost piezo-resistive Flexi-Force sensor for quantitatively analyzing the pressure distribution at eight specific regions. Namely, lateral tibia, gastrocnemius, PTB, kick point, medial tibia, medial gastrocnemius, popliteal depression, and lateral gastrocnemius. Ten clinically significant cases have been considered for pressure prediction under different loading conditions. The present study deals with employing fuzzy logic-based modeling for predicting the pressure at specific locations for the limb socket interface for varying physical characteristics of ten clinical cases. The developed fuzzy logic model is validated by performing confirmation experimental trials and an accuracy of 98.53% is obtained in predicting the response of limb socket interface pressure. The present approach significantly evaluates the pressure variation for different loading conditions. The regression analysis has been employed to evaluate the relation been amputee specific physical parameters on maximum pressure condition at the limb-socket interface. From the results, it has found that the amputee’s weight and SL are critical parameters and play a major role in pressure prediction. The adopted methodology will help in predicting maximum pressure values at the limb-socket interface using which better designed prosthetic sockets can ensure comfortable socket fitting.
ACKNOWLEDGMENT
The authors thank the patients of below-knee amputees at BNWSS (Jaipur Foot) who voluntarily participated in the study. This study was carried under a project grant (Project Number 180400044) by the Department of Science and Technology, Government of India.
KEYWORDS
• force-sensing resistors
• Fuzzy logic analysis
• patella tendon bearing
• pressure measurement
• socket fitting
• stump-socket interface
REFERENCES
1. Alcaide-Aguirre, R. E., Morgenroth, D. C., & Ferris, D. P., (2013). Motor control and learning with lower-limb myoelectric control in amputees. J. Rehabil. Res. Dev., 50(5), 687–698. Pub. Med. PMID: 24013916.
2. Sagar, R., Sahu, A., Sarkar, S., et al., (2016). Psychological effects of amputation: A review of studies from India. Ind. Psychiatry J., 25(1), 4–10. doi: 10.4103/0972–6748.196041.
3. Peters, E. J., Lipsky, B. A., Aragôn-Sánchez, J., et al., (2016). Interventions in the management of infection in the foot in diabetes: A systematic review. Diabetes Metab. Res. Rev., 32, 145–153. doi: 10.1002/dmrr.2706.
4. Al-Fakih, E., Abu, O. N., & Mahmad, A. F., (2016). Techniques for interface stress measurements within prosthetic sockets of transtibial amputees: A review of the past 50 years of research. Sensors, 16(7), 1119. doi: 10.3390/s16071119.
5. Sewell, P., Noroozi, S., Vinney, J., et al., (2012). Static and dynamic pressure prediction for prosthetic socket fitting assessment utilizing an inverse problem approach. Artif. Intell. Med., 54(1), 29–41. doi: 10.1016/j.artmed.2011.09.005.
6. Carlson, C. E., Mann, R. W., & Harris, W. H., (1974). A Radio telemetry device for monitoring cartilage surface pressures in the human hip. IEEE Trans Biomed Eng, BME-21, 257–264. doi: 10.1109/tbme.1974.324311.
7. Al-Fakih, E., Abu, O. N. A., & Mahamd, A. F. R., (2012). The use of fiber bragg grating sensors in biomechanics and rehabilitation applications: The state-of-the-art and ongoing research topics. Sensors, 12(12), 12890–12926. doi: 10.3390/s121012890.
8. Williams, R. B., Porter, D., Roberts, V. C., et al., (1992). Triaxial force transducer for investigating stresses at the stump/socket interface. Med. Biol. Eng. Comput., 30(1), 89–96. doi: 10.1007/bf02446199.
9. Tiwana, M. I., Shashank, A., Redmond, S. J., et al., (2011). Characterization of a capacitive tactile shear sensor for application in robotic and upper limb prostheses. Sens. Actuators A Phys., 165(2), 164–172. doi: 10.1016/j.sna.2010.09.012.
10. Almassri, A. M., Wan, H. W. Z., Ahmad, S. A., et al., (2015). Pressure sensor: State of the art, design, and application for robotic hand. J. Sens., 1, 1–12. doi: 10.1155/2015/846487.
11. Luo, Z. P., Berglund, L. J., & An, K. N., (1998). Validation of F-Scan pressure sensor system_ A technical note. J. Rehabil. Res. Dev., 35(2), 186–191. Pub. Med. PMID: 9651890.
12. Nayak, C., Singh, A., Chaudhary, H., et al., (2016). A novel approach for customized prosthetic socket design. Biomed. Eng. App. Bas. C, 28(3). doi: 10.4015/s1016237216500228.
13. Nayak, C., Singh, A., Chaudhary, H., & Unune, D. R., (2017). An investigation on effects of amputee’s physiological parameters on maximum pressure developed at the prosthetic socket interface using artificial neural network. Technology and Health Care, 25(5), 969–979.
14. Pathak, V. K., Nayak, C., Singh, A. K., & Chaudhary, H., (2016). A virtual reverse engineering methodology for accuracy control of transtibial prosthetic socket. Biomedical Engineering: Applications, Basis and Communications, 28(05), 1650037.
15. Pirouzi, G., Abu, O. N. A., Eshraghi, A., et al., (2014). Review of the socket design and interface pressure measurement for transtibial prosthesis. Sci. World J., 1, 1–9. doi: 10.1155/2014/849073.
16. Hafner, B. J., & Sanders, J. E., (2014). Considerations for development of sensing and monitoring tools to facilitate treatment and care of persons with lower-limb loss: A review. J. Rehabil. Res. Dev., 51(1), 1–14. doi: 10.1682/jrrd.2013.01.0024.
17. Singh, R. K., Gangwar, S., Singh, D. K., & Pathak, V. K., (2019). A novel hybridization of artificial neural network and moth-flame optimization (ANN-MFO) for multi-objective optimization in magnetic abrasive finishing of aluminum 6060. Journal of the Brazilian Society of Mechanical Sciences and Engineering, 41(6), 270.
18. Mariajayaprakash, A., Senthilvelan, T., & Gnanadass, R., (2015). Optimization of process parameters through fuzzy logic and genetic algorithm_ A case study in a process industry. Applied Soft Computing, 30, 94–103.
19. Nunes, I. L., (2010). Handling human-centered systems uncertainty using fuzzy logics-A. The Ergonomics Open Journal, 3, 38–48.
20. Neumann, E., Brink, J., Yalamanchili, K., & Lee, J. S., (2013). Regression estimates of pressure on transtibial residual limbs using load cell measurements of the forces and moments occurring at the base of the socket. J. Ortho and Prosthet., 25(1), 1–12. doi: 10.1097/JPO.0b013e31827b36.